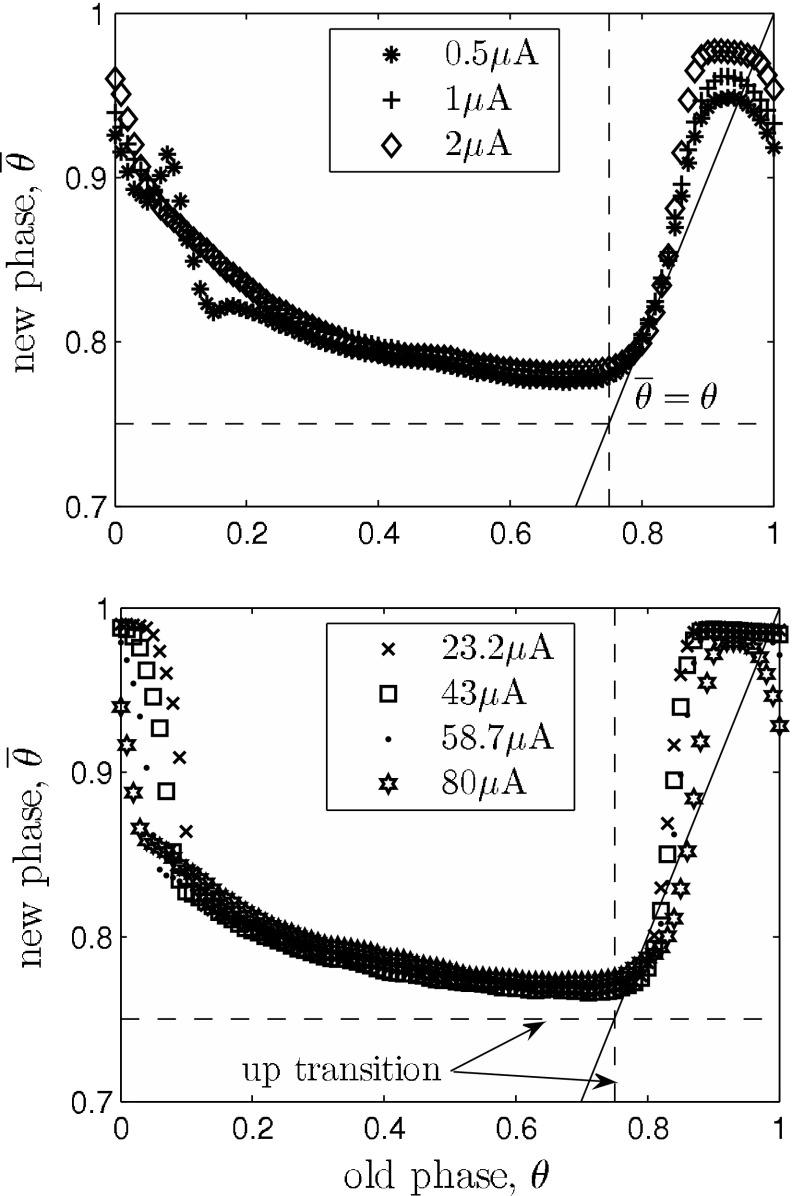
Fig. 6.
Phase transition curves (PTCs) of the network model for Type 0 (strong) resetting. The solid line marks the condition  , e.g. slope 1. The shortening of an up state that results from a stimulation at
  is almost independent of the stimulus intensity, as indicated by the overlapping curves in that range. Significant differences are apparent at the transition from up to down state and down to up state, respectively. Top the PTCs mostly stay above
  , indicating that in this intensity range up state durations can only be decreased. Bottom the model predicts that there is a refractory period only for mediumly strong stimuli (
 ), as the phase transition curve is close to
  . Also, the slopes near the state transitions are steeper for strong stimuli. Hence it is more likely for very strong stimuli to have the desynchronizing effect shown in Fig. 7

