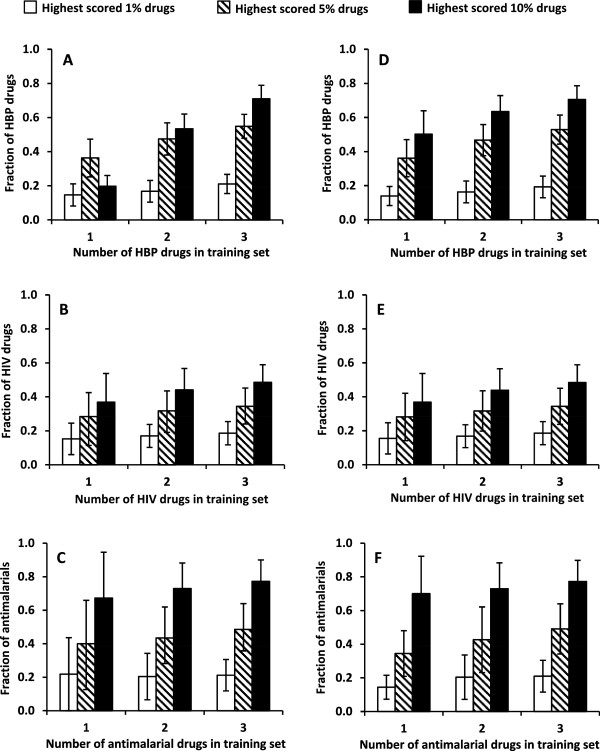
Figure 3.

Performance comparison between type I and type II models. Comparison of enrichment efficiencies of type I (A-C) and type II (D-F) models for high blood pressure (HBP), HIV, and antimalarial drugs. The models were built with one, two, and three drugs in the positive class of the training set. Bar heights denote the fraction of FDA-approved HBP, HIV, and antimalarial drugs in the testing set (type I models) or baseline class (type II models) that scored in the highest 1%, 5%, and 10% of the compounds, respectively. Error bars represent 1 standard deviation from full cross-validation calculations.
