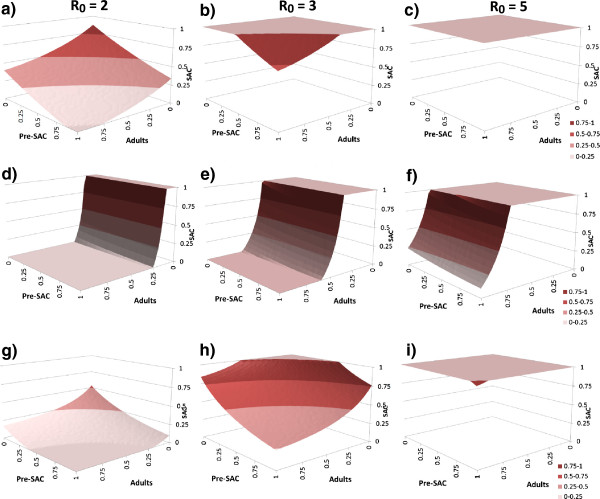
Figure 3.

The critical treatment surfaces for Ascaris (row 1: a, b, c, and 3: g, h, i) and hookworm (row 2: d, e, f). Reproductive number R0 is 2, 3 and 5 in columns 1 (a, d, g), 2 (b, e, h) and 3 (c, f, i), respectively. In rows 1 (a, b, c) and 2 (d, e, f), treatment is yearly while in row 3 (g, h, i), treatment is every 6 months. Model parameters as in Additional file 1: Table S2. The proportion treated effectively (proportion treated x drug efficacy) in each age grouping (pre-SAC, SAC & Adults) must lie above the ‘critical’ surface in the 3D plots (at the plateau of 1.0 all must be treated effectively) for eradication to occur. The colours indicate coverage in SAC.
