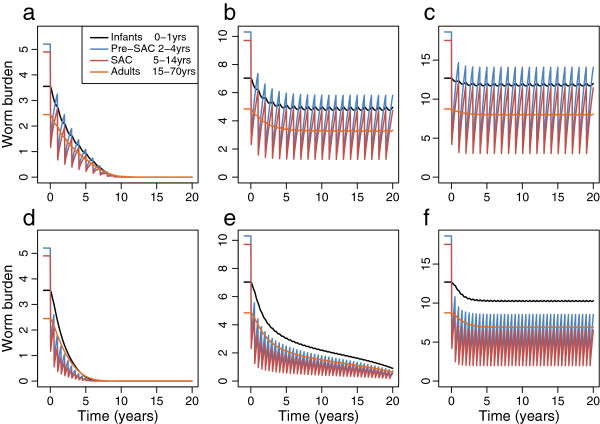
Figure 4.

Numerical solutions of the model for different transmission settings (R0 of 2 (a, d), 3 (b, e) and 5 (c, f)) and yearly (a, b, c) or twice-yearly (d, e, f) treatment with 80% treatment in Pre-SAC and SAC. The mean worm burden in Infants (black), Pre-SAC (blue), SAC (red) and Adults (orange) is shown reducing over time. Other parameters as in Additional file 1: Table S2.
