Fig. 3.

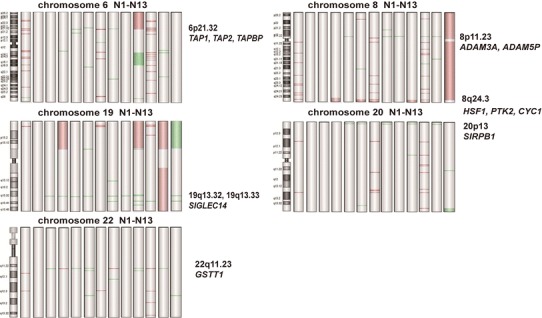
Ideograms of genomic alterations on chromosomes 6, 8, 19, 20, and 22. Genomic alterations are underlined with green bars for losses and red bars for amplifications marking the minimally involved chromosome regions

Ideograms of genomic alterations on chromosomes 6, 8, 19, 20, and 22. Genomic alterations are underlined with green bars for losses and red bars for amplifications marking the minimally involved chromosome regions