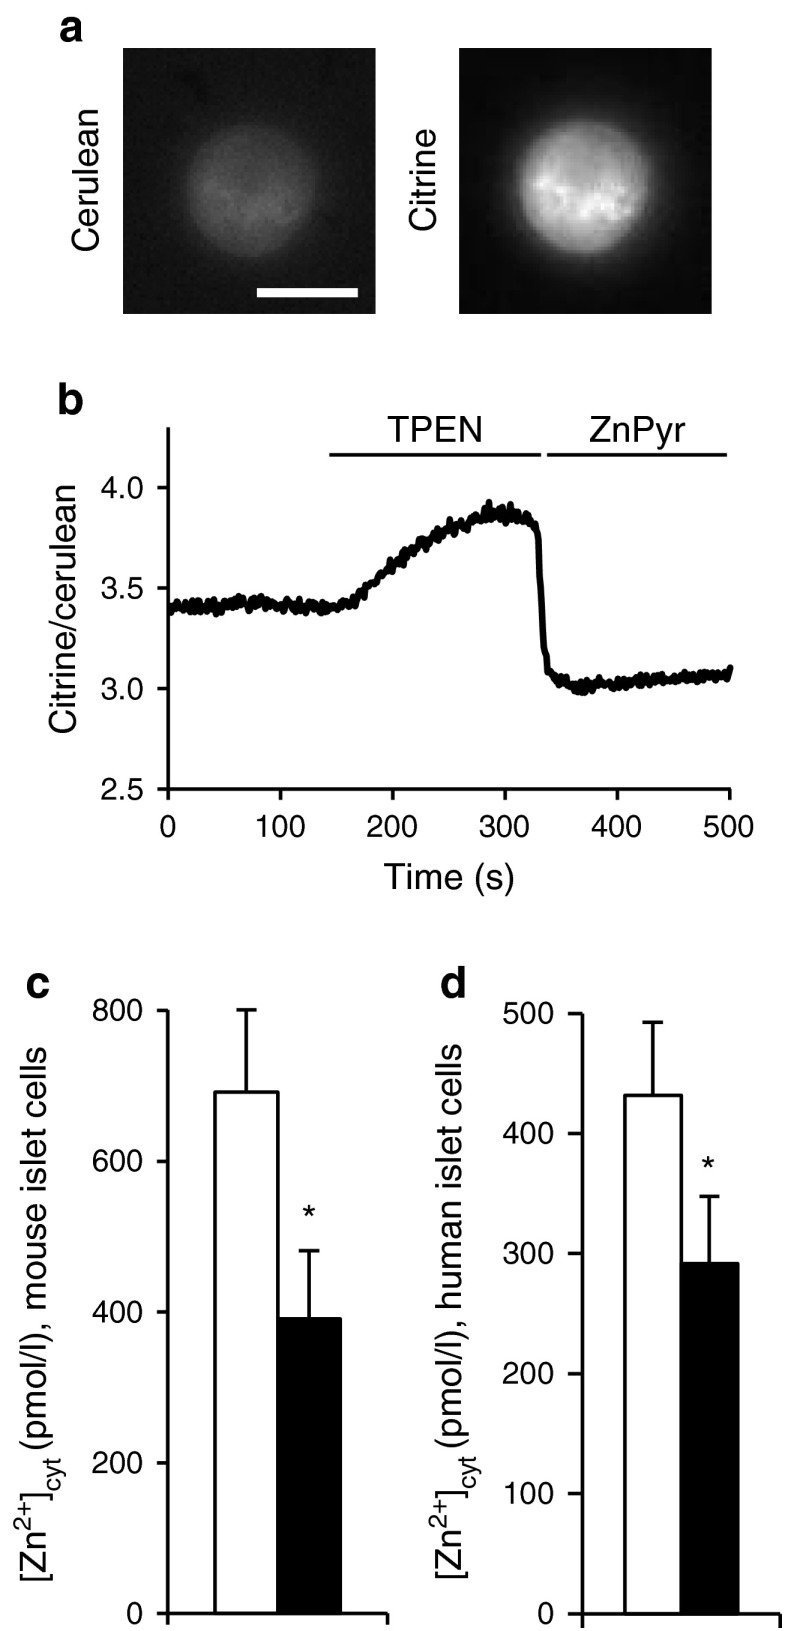
Fig. 1.
Imaging the effect of hypoxia on [Zn2+]cyt in dissociated islets. (a) [Zn2+]cyt was measured in dissociated CD1 mouse islets as described in the Methods section. Scale bar, 10 μm. (b) A representative trace showing changes in citrine/cerulean fluorescence ratio; ZnPyr, 5 μmol/l pyrithione/100 μmol/l ZnCl2. (c, d) Analysis of [Zn2+]cyt in dissociated (c) CD1 mouse and (d) human islets exposed for 24 h to normoxia (white bars) or hypoxia (black bars). Bars represent mean ± SE. * p < 0.05

