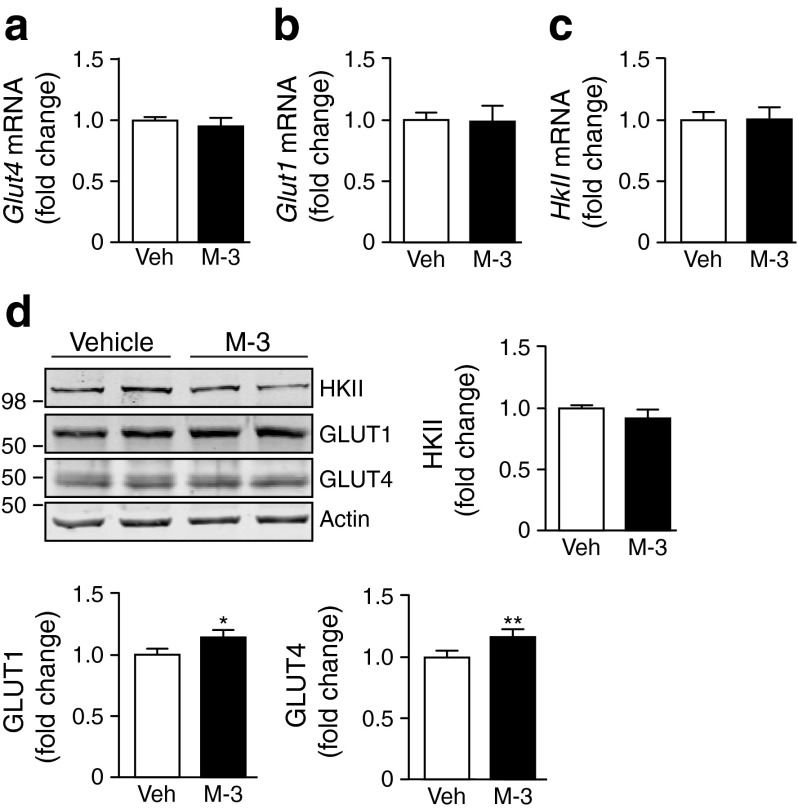
Fig. 2.
BACE1 inhibition modifies expression of glucose transporters. Quantitative PCR analysis of mRNA for (a) Glut4, (b) Glut1 and (c) HkII in control and M-3-treated myotubes. (d) Representative immunoblots of HKII, GLUT1 and GLUT4 in control and M-3-treated myotubes, with quantification of the immunoblot data shown (n = 8). Veh, vehicle. *p = 0.05, **p < 0.01 vs vehicle alone

