Figure 6.

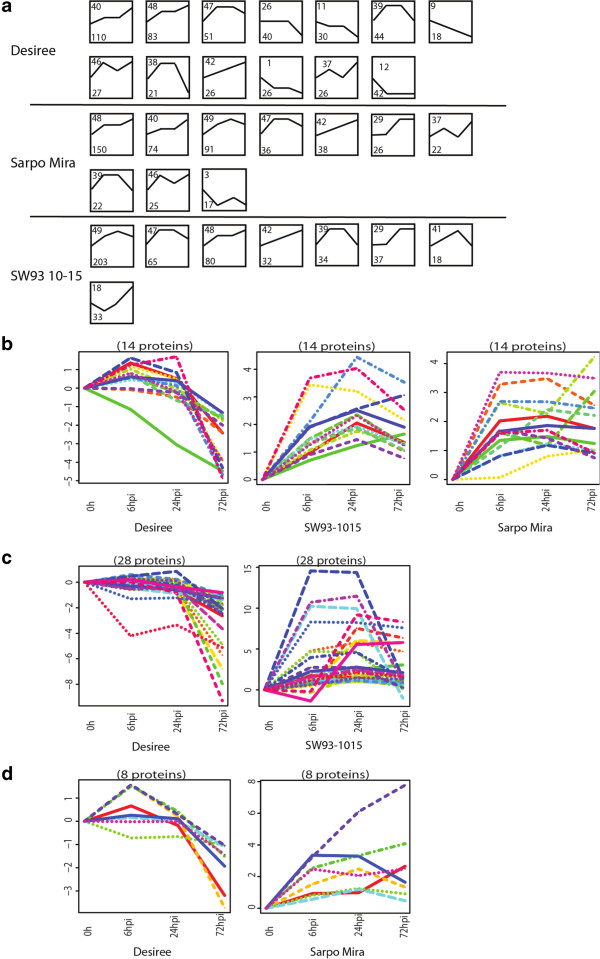
Identification of candidates for effector targets. (a) Significant profiles from STEM clustering of apoplastic proteins at 0, 6, 24, and 72 hpi in the three potato clones. Protein intensities from four replicates for each sample were used for clustering. Only proteins with statistically significant differences for at least at one time point were used. Each box represents a protein abundance pattern during the time course. Top left of each box is the profile number defined in STEM and bottom left of each box indicates the number of proteins that fit the defined profile pattern. (b) Proteins found with decreased abundance profiles in Desiree, but increased abundance profiles in both Sarpo Mira and SW93-1015. (c) Proteins found with decreased abundance profiles in Desiree but with increased abundance profiles in SW93-1015. (d) Proteins found with decreased abundance profiles in Desiree but with increased abundance profiles in Sarpo Mira.
