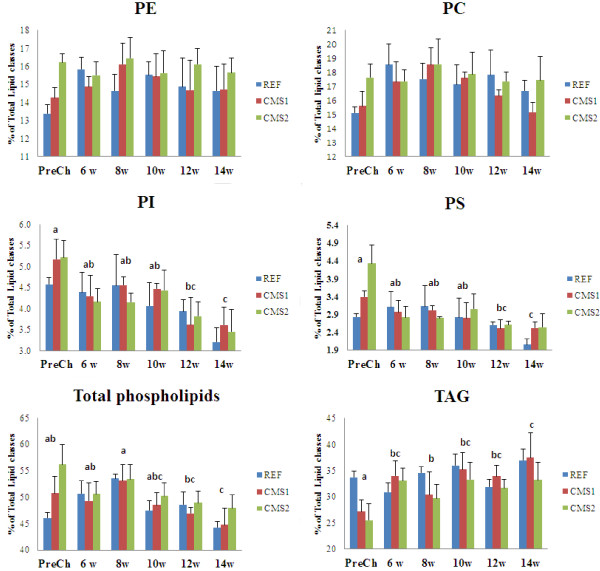
Figure 1.

Proportions of lipid classes in total lipid of heart tissue from fish fed the reference (REF) and functional (CMS1 and CMS2) feeds at different times before (PreCh) and after (6, 8, 10, 12 and 14 weeks) infection with PMCV. Data were analysed by 2-way ANOVA with “time-course” and “diet” as the two factors. Different letters above time-points indicate significant differences between time-points over the time-course of the infection. The factor diet showed significant differences in PC, PE, total phospholipids and TAG (not indicated). PC, phosphatidycholine; PE, phosphatidylethanolamine; PI, phosphatidylinositol; PS, phosphatidylserine; TAG, triacylglycerol.
