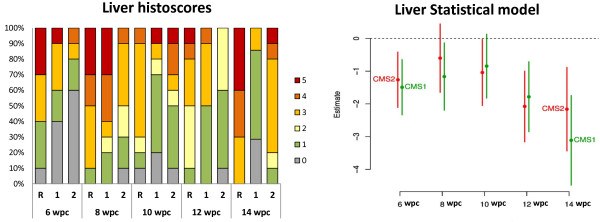
Figure 3.

Histopathology results in liver tissue. Figure on the left is representing incidence (percentage of fish sampled) and severity of histopathology (based on the criteria described in methods) at 6-, 8-, 10-, 12-, 14-weeks post-challenge in fish fed the Reference diet (R), and the two functional feeds CMS1 (1) and CMS2 (2). Figure on the right is representing the statistical analysis of liver histoscores. Estimated effects of CMS1 and CMS2 diets in comparison to the REF diet by sampling weeks. Negative estimates mean there are lower scores and positive that there are higher scores than for the REF dietary group. Error bars denote approximate 95% confidence limits.
