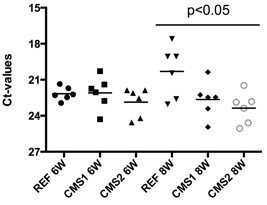
Figure 4.

Viral load in heart tissue of the different dietary groups at 6- and 8-weeks post-challenge. Viral load was determined by quantitative real-time PCR analysis of Piscine Myocarditis Virus. Results are presented as CT values (normalized) as a basis for showing the relative level of virus expression (n = 6) Levels of significant differences (t-test) were calculated using the relative expression software tool (REST 2009).
