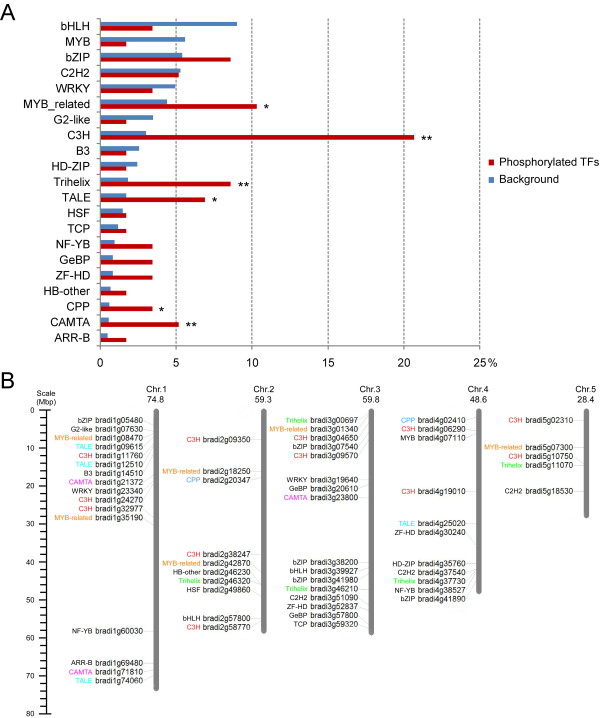
Figure 4.

Analysis of phosphorylated transcription factors (TFs). (A) TF family enrichment analysis by using a two-sided test of the hypergeometric distribution. The number of phosphorylated TFs belonging to a TF family was compared against the total number of TFs in that family of B. distachyon. The six significantly over-represented TF families are marked with *p < 0.05 or **p < 0.01. (B) Chromosomal localization of genes of all phosphorylated TFs on the five chromosomes of B. distachyon. The chromosome numbers and their size (Mb) are indicated at the top of each bar.
