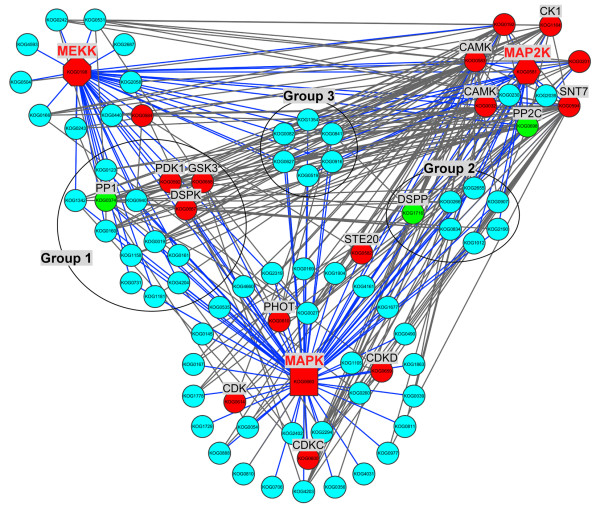
Figure 7.

Phosphorylation regulatory network centered by MAPK cascade. Protein kinases and protein phosphatases are highlighted in red and green, respectively and other phosphoproteins identified in this study are shown with sky-blue nodes. Edges with blue color represent the phosphoproteins with direct relationship to MEKK, MAP2K or MAPK.
