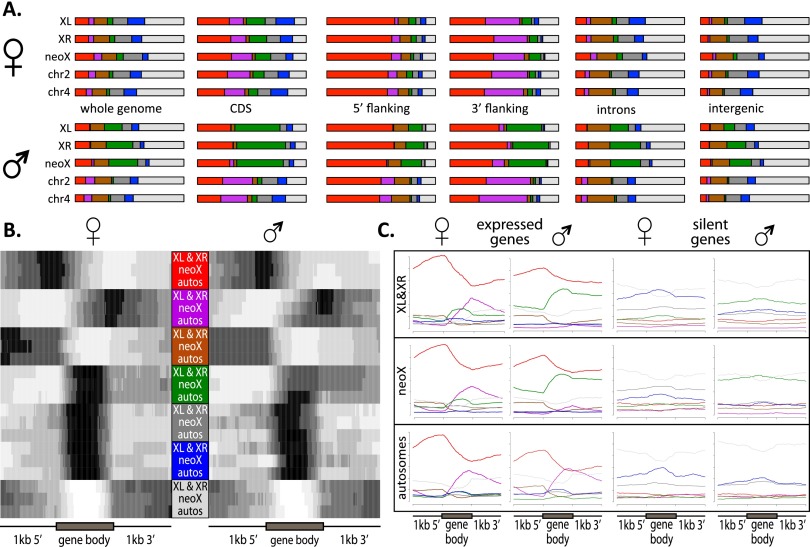
Figure 4.
Distribution of chromatin states in D. miranda across genomic features and gene bodies. (A) Proportion of different chromatin states across chromosomes and different functional categories. (B) Enrichment of chromatin states across all genes (size-normalized, indicated by gray box), including 1 kb 5′ and 3′ of CDS. (C) Frequency of each chromatin state across size-normalized genes (including 1 kb 5′ and 3′ of CDS) categorized by RNA-seq as expressed or silent (FPKM > 1 or FPKM < 1).

