Figure 3.
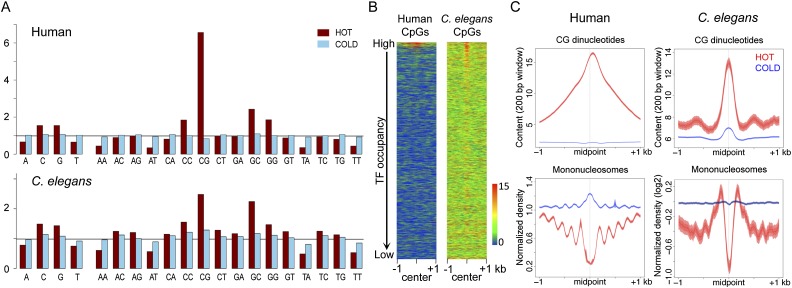
HOT regions are enriched for CpG dinucleotides and depleted for nucleosomes. (A) Frequency of the indicated mono- and dinucleotides in HOT (red) and COLD (blue) regions is shown relative to the genome-wide frequency scaled to one (black horizontal line). (B) Heat maps showing the distribution of CpG density in ranked TF overlap regions in human and C. elegans. The color scheme shows the scale (0 to 15) for CpG content in a 200-bp window. (C) The distribution of CpG density (top) and nucleosomes (bottom) was plotted for HOT (red) and COLD (blue) regions in the human and C. elegans genomes. Lines show mean signal, darker filled areas show standard error, and lighter filled areas are 95% confidence intervals. All plots show 2-kb regions centered at the midpoint of core regions.

