
Figure 7.
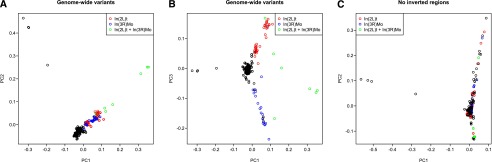
Principal component analysis of DNA sequence variation in the DGRP. Principal components (PCs) are computed using EIGENSTRAT. (A) PC plot of PC1 versus PC2. (B) PC plot of PC1 versus PC3. (C) PC plot of PC1 versus PC2 after PCs were recomputed excluding all variants in regions encompassing major inversions (In[2L]t, In[2R]NS, In[3R]P, In[3R]K, In[3R]Mo). With the exception of four highly related pairs of lines, there is no apparent clustering of karyotype groups.