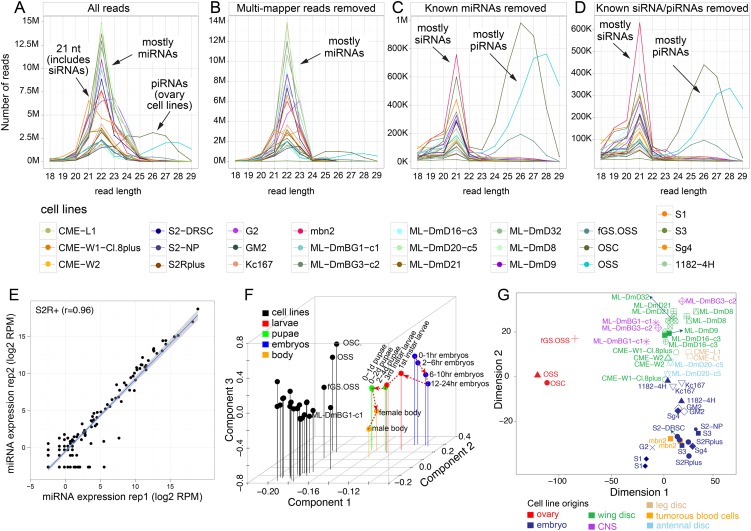
Figure 1.
Size distributions of small RNA reads across the 25 Drosophila cell lines. Shown are the distributions of all mapped reads (A) and following sequential removal of multimapper reads (B), of reads from known miRNA loci (C), of reads from known endo-siRNA loci (of the 3′-cis-NAT and hpRNA classes) and of known 3′ UTR piRNA loci (D). Annotated small RNA classes exhibit characteristic preferred sizes, namely, ∼21-nt siRNAs, 22-nt dominant miRNAs, and ∼24- to 29-nt piRNAs. This analysis highlights that an abundance of uniquely mapping, novel siRNA and piRNA reads remains after accounting for all previously annotated Drosophila small RNAs. The color guides for the different cell lines are shown below, and all replicate data were combined for this analysis. The piRNAs were mainly expressed by the ovary-derived cell lines fGS/OSS, OSS, and OSC. (E) Biological replicates of S2R+ small RNAs showed high correlation (r = 0.97). All cell line replicates were well correlated (r > 0.89) (see also Supplemental Fig. S1). (F) Principal component analysis based on sRNA (miRNAs, TE-siRNAs, TE-piRNAs, and piRNA master clusters) expression clearly separates all cell lines from data sets acquired from across a developmental time course. (G) Multidimensional scaling based on sRNAs shows that cell line replicates are generally grouped together, and cell lines from the same tissue origins are generally well grouped together.

