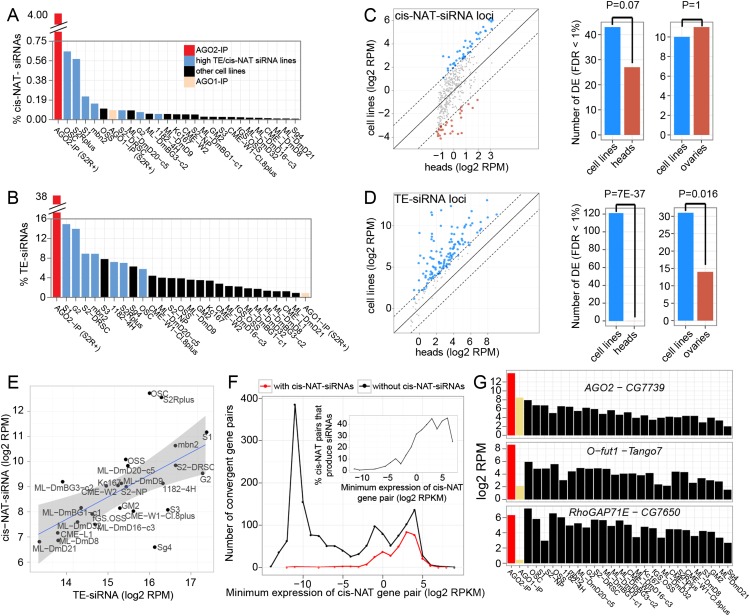
Figure 4.
Features of endo-siRNA expression across Drosophila cell lines. (A) Expression of 21-nt 3′-cis-NAT-siRNA loci across cell lines. All are total RNA libraries, except for AGO2-IP and AGO1-IP data sets from S2R+ cells. (B) Expression of 21-nt TE-siRNAs across cell lines. Light blue bars show the intersection (seven cell lines) of the top 10 ranked cell lines with the highest cis-NAT-siRNA and TE-siRNA expression. (C,D) Comparison of TE-siRNA and 3′-cis-NAT-siRNA expression in cell lines and tissues. Differentially expressed siRNAs (FDR < 1%, see Methods) are shown in blue (high in cell lines) and red (high in tissues). Scatter plots show mean expression in cell lines vs. head libraries for each siRNA loci (−4 indicates fourfold changes marked as dashed lines around 0). Comparisons to other tissues are in Supplemental Figure S10. Barplots compare number of differentially expressed siRNA loci in cell lines vs. heads and ovaries (P-values by binomial test). (E) Correlation of TE-siRNA and 3′-cis-NAT-siRNA expression across cell lines. Linear regression lines were fit to the data, and bands show the standard error at each position (R2 = 0.38). (F) Comparison of 3′-cis-NAT-siRNA and parent cis-NAT-mRNA expression. Plotted are the number of cis-NAT loci at the designated bins of the lower-expressed mRNA partner (to define the minimum cis-NAT expression level), split into loci that did or did not produce siRNAs. (G) Examples of 3′-cis-NAT loci that generated substantial siRNAs in most or all cell lines analyzed.

