Fig. 4.
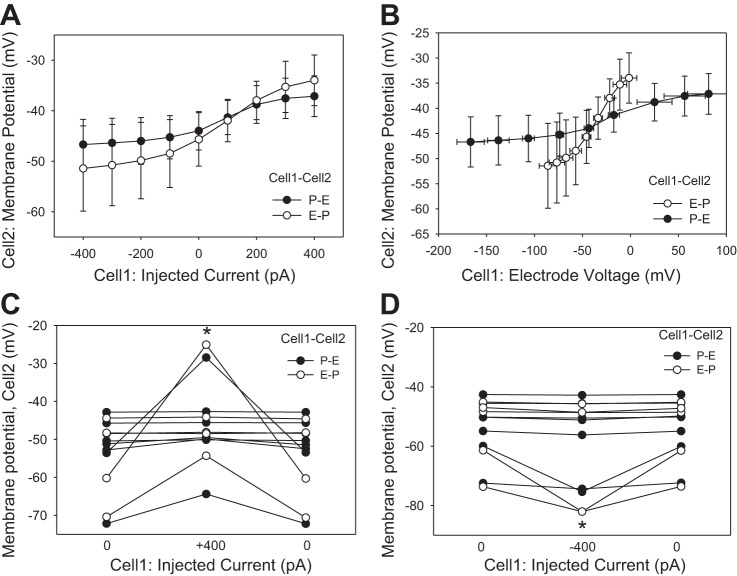
Cell1 and Cell2 potentials during current injections in myo-endothelial configurations. A: end-pulse Cell2 membrane potentials vs. current injected into Cell1 in the P-E and E-P configurations. B: end-pulse Cell2 membrane potentials in the P-E and E-P configurations vs. the electrode voltage required to drive current into Cell1. C: myoendothelial Cell2 membrane potentials and their reversal during Cell1 injections of +400 pA in the P-E (●) or E-P (○) configurations (*P < 0.05 vs. 0 pA). D: Cell2 membrane potentials and reversal during Cell1 injections of −400 pA in the P-E (●) or E-P (○) configurations (*P < 0.05 vs. 0 pA).

