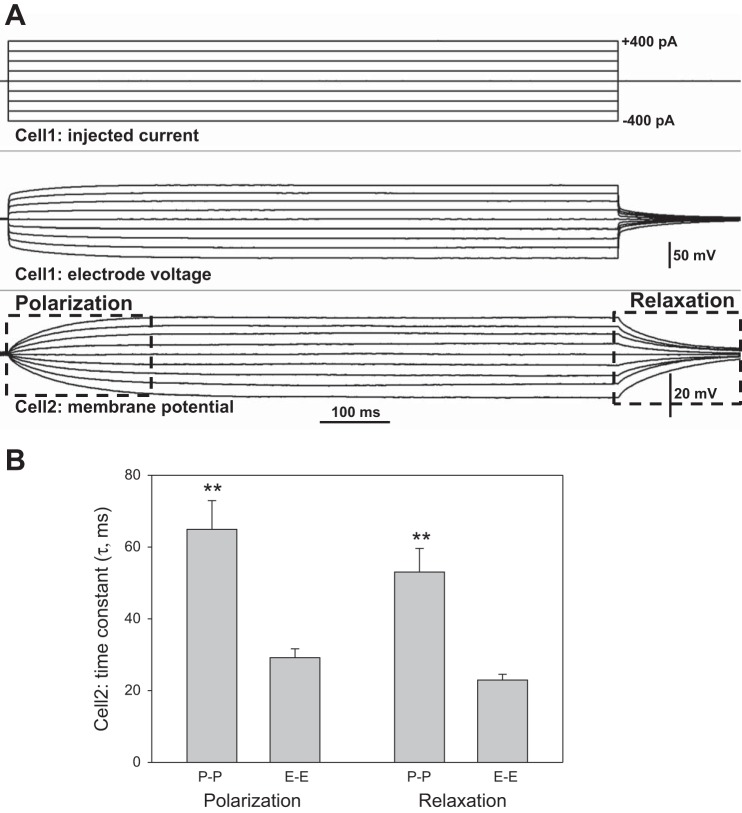
Fig. 5.
Polarization and relaxation time constants during current injections in P-P and E-E configurations. A: example shows the Cell1 current injection protocol (top) and the associated membrane potential response observed at Cell2 (bottom). Boxes outline the polarization and relaxation phases wherein exponential fits to the data yielded time constants. B: means ± SE of time constants (τ) obtained by fitting a single exponential of the form, y = A exp(−t/τ) + C, to the polarization and relaxation phases, where τ, A, and C are constants. In either the P-P or E-E configuration, time constants were similar for polarization and relaxation phases of the response. Time constants in the P-P (n = 8) configuration were longer than those for E-E (n = 6, **P < 0.01).

