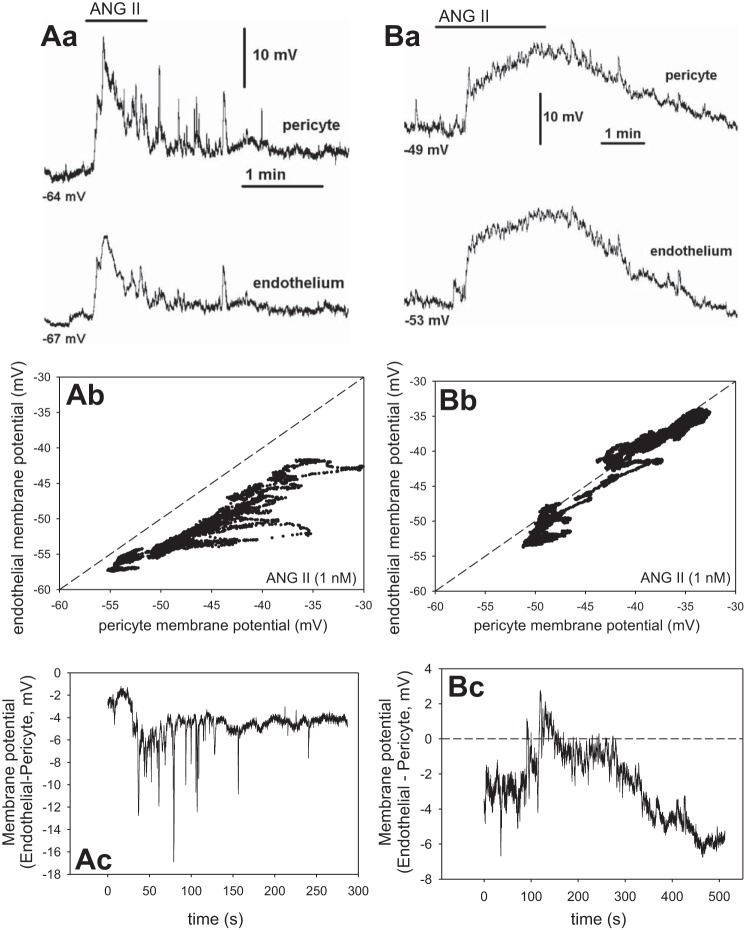
Fig. 7.
Simultaneous membrane potential recording in pericytes and endothelia during exposure to ANG II (1 nM). Aa: recordings show temporal similarity of pericyte (top) and endothelial (bottom) membrane potentials during exposure to ANG II. Starting value of membrane potential in the 2 cells was −64 and −67 mV, respectively. Ab: pericyte vs. endothelial membrane potential from Aa. Dashed line is identity. Ac: membrane potential difference vs. time. Ba: record of membrane potential during ANG II exposure in a second vessel. Starting membrane potentials were −49 and −53 mV. Bb: pericyte vs. endothelial membrane potential from Ba. Bc: membrane potential difference vs. time. These 2 records are similar to n = 5.

