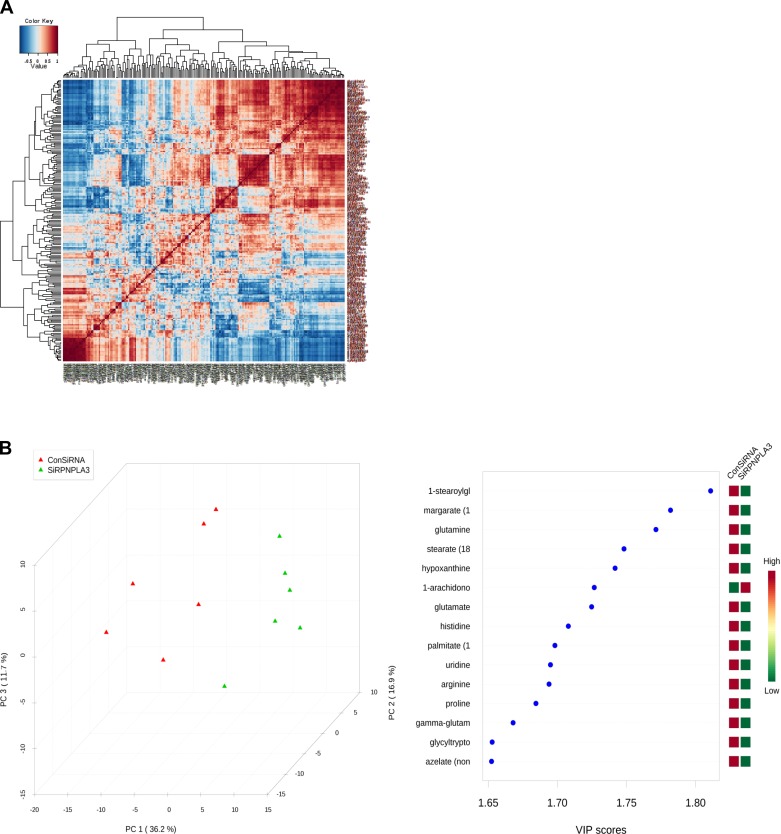
Fig. 2.
A: PNPLA3 siRNA silencing in Huh-7 cells in vitro: overall correlation pattern among metabolites, with color intensity representing Spearman rank correlation coefficient. B: partial least squares discriminant analysis score (PLS-DA) plot. Left: PLS-DA was performed to identify compounds that contribute most to the separation between groups (PNPLA3 siRNA and negative control). Tridimensional plot of the 3 first principal components shows that the complete separation in clusters of the samples classified in the correct groups. Right: VIP, variable importance in prediction.

