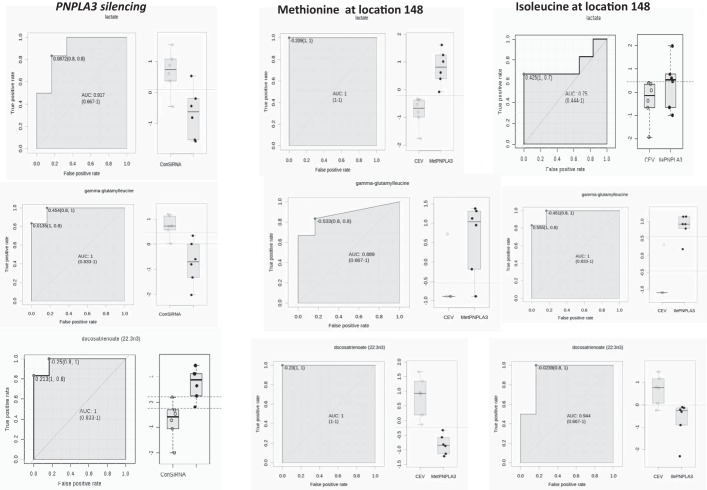
Fig. 5.
Receiver Operating Characteristic (ROC) Curve analysis for the most significantly associated metabolites in the overexpression of the PNPLA3 with Met148 or Ile148 in comparison with PNPLA3 silencing. ROC-based analysis on the data sets was performed by the web-based tool ROCCET (http://www.roccet.ca/). As an example, comparisons were performed by Lactate, gamma-glutamyl-leucine and docosatrienoic acid.

