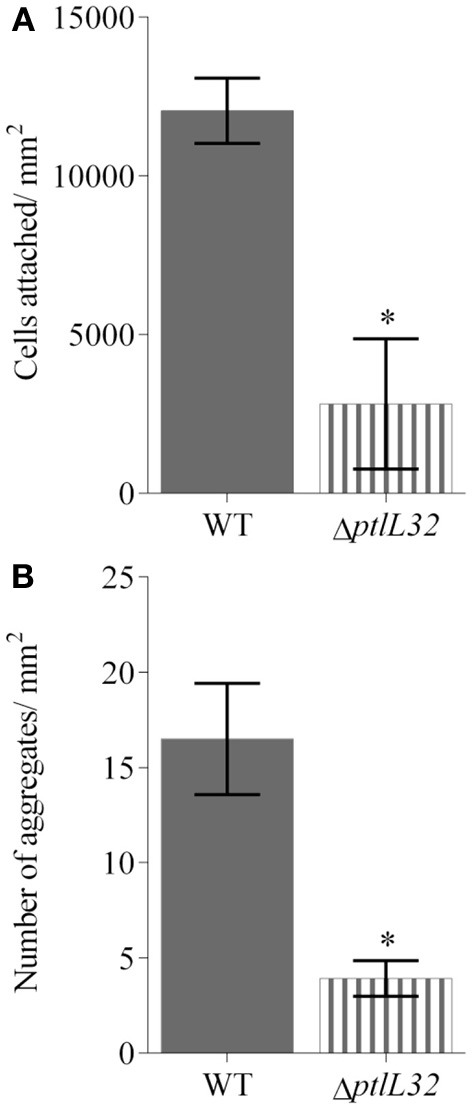
Figure 4.

Average number of cells attached to (A), and cell aggregates (defined as a tight cluster of >10 cells) (B) on U. australis for GFP-labeled WT (solid fill) and GFP-labeled ΔptlL32 (horizontal stripes) after 6 h incubation. The number of green fluorescing cells or aggregates in each field of view was counted using ImageJ and an average expressed for cells per mm2. Error bars represent standard deviation. Error bars represent standard deviation at 45 replicates and * denotes a significant difference with a p < 0.001 using the unpaired Students two-tailed t-test.
