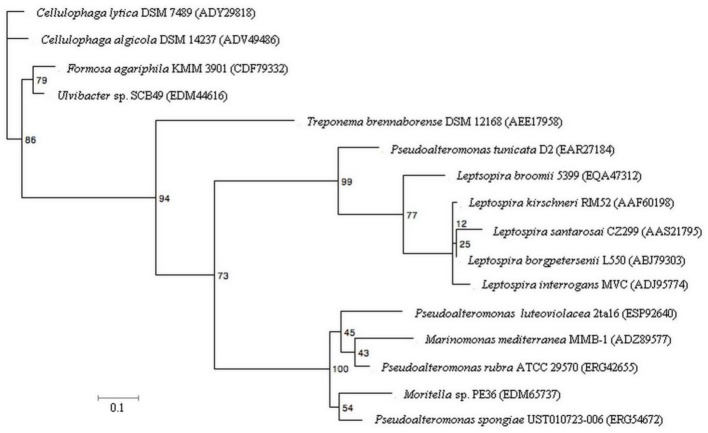
Figure 5.
Maximum-likelihood tree of PtlL32 and orthologous protein sequences in non-Leptospira species. Five representative Leptospira LipL32 sequences were included for comparison with the non-Leptospira sequence. NCBI GenBank accession numbers for each protein sequence is provided in brackets. Bootstrap values for 100 replicates are shown for each node. The scale bar represents 10% sequence divergence.

