
Fig. 2.
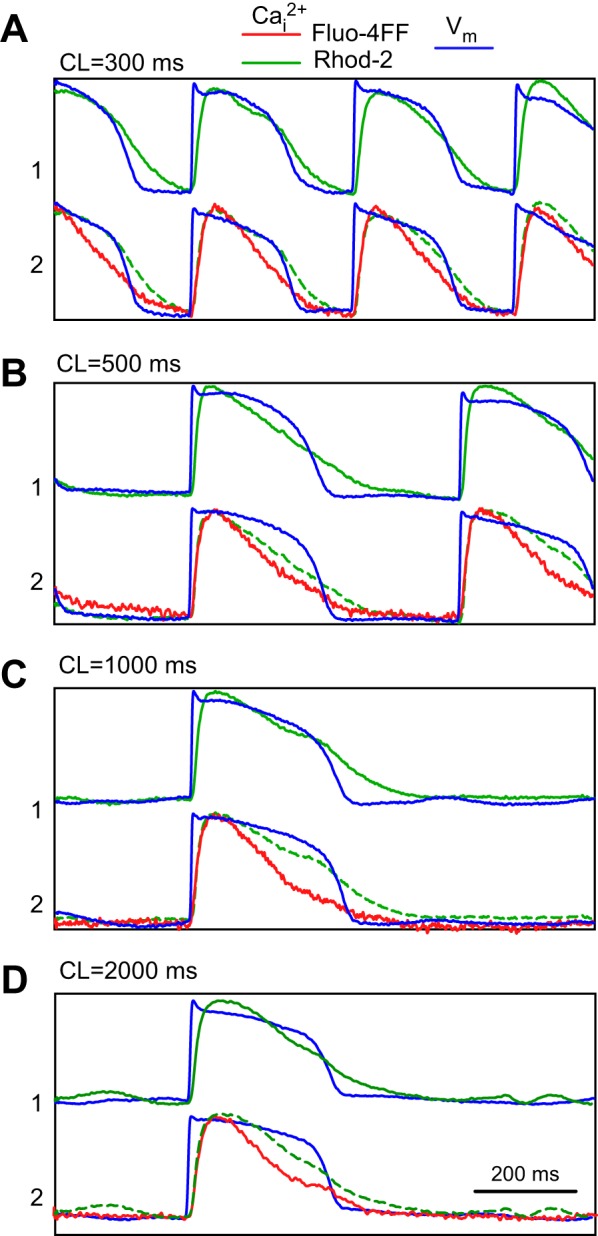
Comparison of Cai2+ transients measured using high-affinity dye Rhod-2 (site 1, green traces) and low-affinity dye Fluo-4FF (site 2, red traces), and corresponding transmembrane potential (Vm) recordings (blue traces) at different cycle lengths (CLs): 300 ms (A), 500 ms (B), 1,000 ms (C), and 2,000 ms (D). Green dashed lines duplicate Rhod-2 signals from site 1 to compare them with Fluo-4FF traces. Traces are individually normalized.