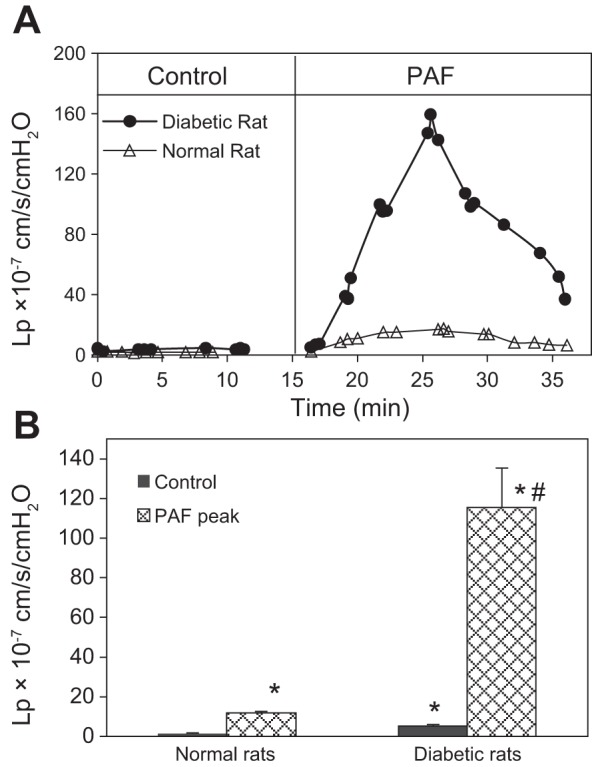
Fig. 1.

Comparisons of baseline hydraulic conductivity (Lp) and platelet-activating factor (PAF)-induced Lp changes between normal and diabetic venules. A: the overlay of 2 individual experiments demonstrates the differences in time course and the magnitude of the Lp changes between a normal and a diabetic venule. B: summarized data showing that in diabetic venules (n = 5), the mean baseline Lp was elevated from 1.6 ± 0.1 (normal vessel, n = 7) to 5.1 ± 0.7 × 10⁻⁷ cm·s−1·cmH2O−1, whereas in PAF-induced Lp, the mean peak Lp was potentiated from 12.0 ± 1.8 (normal vessel) to 115.4 ± 20.2 10−7 cm·s−1·cmH2O−1. Intraperitoneal injection of vehicle (sham control) showed no effects on baseline Lp and PAF-induced Lp increases (n = 3). *Significant increases from control; #significant increases from normal vessel responses.
