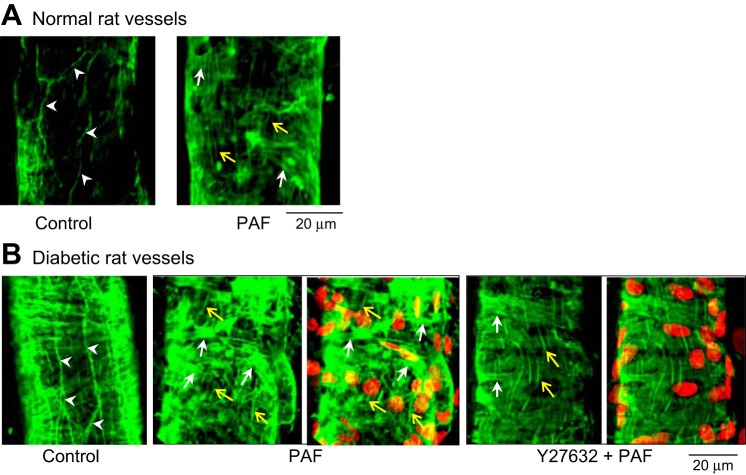
Fig. 6.
Confocal images of phalloidin staining of F-actin in normal and diabetic microvessels. A: in normal vessels, F-actin was located at the peripheral of endothelial cells under control conditions (arrowheads). At the PAF-induced Lp peak, endothelial peripheral F-actin disappeared and was replaced by stress fibers (green, vertically oriented), indicated by yellow arrows. Pericyte F-actin (horizontally oriented) was indicated by white arrows. These changes correlated to a Lp increase from 1.6 (control) to 12.0 × 10⁻⁷ cm·s−1·cmH2O−1. B: F-actin staining in diabetic vessels. Under control conditions, F-actin (left) remained at the peripheral of endothelial cells (arrowheads). At the PAF-induced Lp peak (2nd and 3rd from left), there was markedly increased stress fibers in endothelial cells (yellow arrows), and the pericyte F-actin also formed disorganized bundles (white arrows), indicating pericyte contraction. Red shows DRAQ5-labeled nuclei. These changes in F-actin correlated to a Lp increase, 10 times higher than that in the normal vessels shown in A. The 2 right images show that the application of Y27632, a Rho kinase inhibitor, prevented the increased stress fiber formation and pericyte contraction at the PAF-induced Lp peak and restored the F-actin pattern close to that in normal vessels. This reflected >90% reduction of the PAF-induced Lp increases in diabetic vessels.

