Fig. 3.
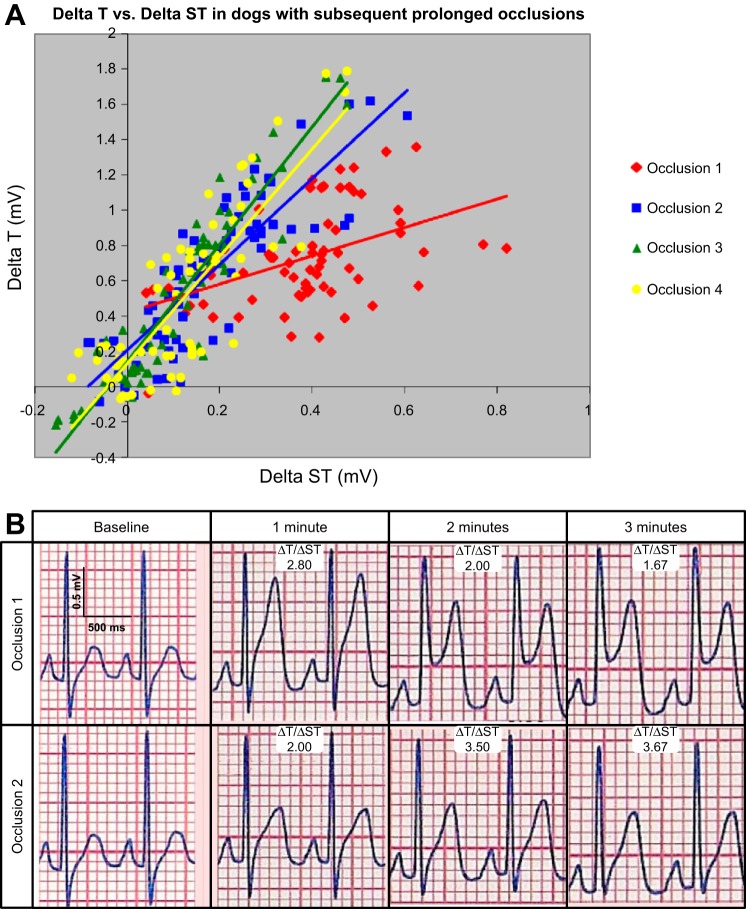
A: ΔT vs. ΔST in subsequent occlusions in canine preconditioning experiments. An increase in ΔT/ΔST is graphed in four subsequent occlusions during canine preconditioning. Occlusions 2-4 show a significant increase in ΔT (ΔT > ΔST) compared with occlusion 1 (P < 0.001). B: example body-surface ECGs are presented for occlusion 1 and 2 in one canine subject. There is a large amount of ST elevation and high T wave amplitude during occlusion 1. During occlusion 2, there is greater T wave amplitude increase relative to the amount of ST elevation, reflecting a greater ΔT-to-ΔST ratio.

