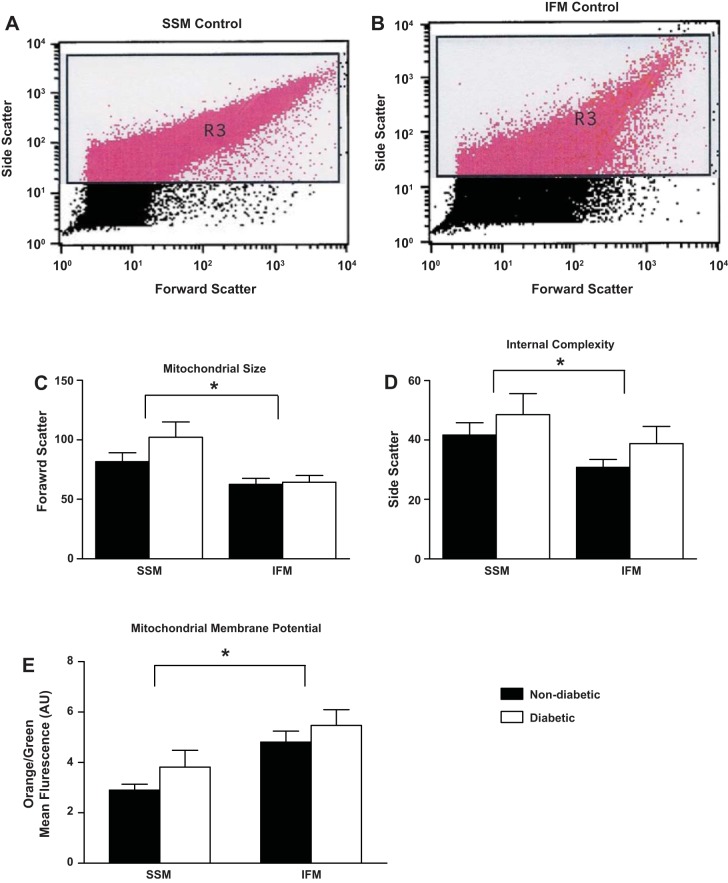
Fig. 1.
Mitochondrial characteristics. Cardiac mitochondrial subpopulations were isolated and incubated with the ratiometric dye 5,5′,6,6′-tetrachloro-1,1′,3,3′-tetraethylbenzimidazol carbocyanine iodide (JC-1). Forward scatter and side scatter were used to analyze isolated mitochondria as seen by representative histograms of nondiabetic subsarcolemmal mitochondria (SSM; A) and nondiabetic interfibrillar mitochondria (IFM; B). Mitochondrial size (C) and internal complexity (D) were quantified for each mitochondrial subpopulation. By calculating the ratio of green to orange fluorescence, membrane potential (E) was quantified for nondiabetic and diabetic SSM and IFM. Black bars represent patients without diabetes, and white bars represent patients with diabetes. AU, arbitrary units. *P ≤ 0.05, SSM nondiabetic vs. IFM nondiabetic; n = 28 patients without diabetes, and n = 23 patients with diabetes.

