
Fig. 4.
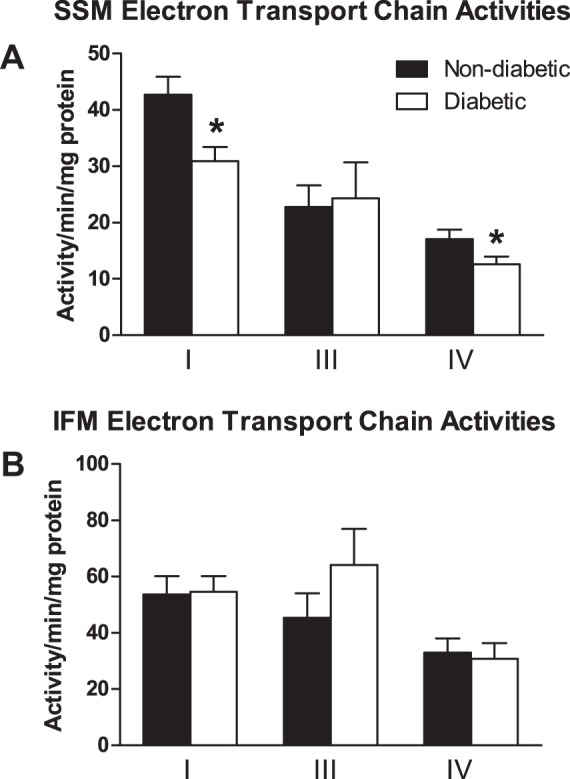
Electron transport chain (ETC) activities in mitochondrial subpopulations. Cardiac mitochondrial subpopulations were isolated and ETC complex I, III, and IV activities were measured in the nondiabetic and diabetic SSM (A) and IFM (B). SSM complex I (n = 47 patients without diabetes, and n = 34 patients with diabetes) and SSM complex III and IV (n = 47 patients without diabetes and n = 33 patients with diabetes) are shown. IFM complex I (n = 46 patients without diabetes, and n = 33 patients with diabetes), IFM complex III (n = 45 patients without diabetes, and n = 33 patients with diabetes), and IFM complex IV (n = 45 patients without diabetes and n = 32 patients with diabetes) are shown. Values are means ± SE. Units are activity per minute per milligram of protein. Black bars represent patients without diabetes, and white bars represent patients with diabetes. *P ≤ 0.05, SSM nondiabetic vs. SSM diabetic (n = 47 patients without diabetes, and n = 34 patients with diabetes).