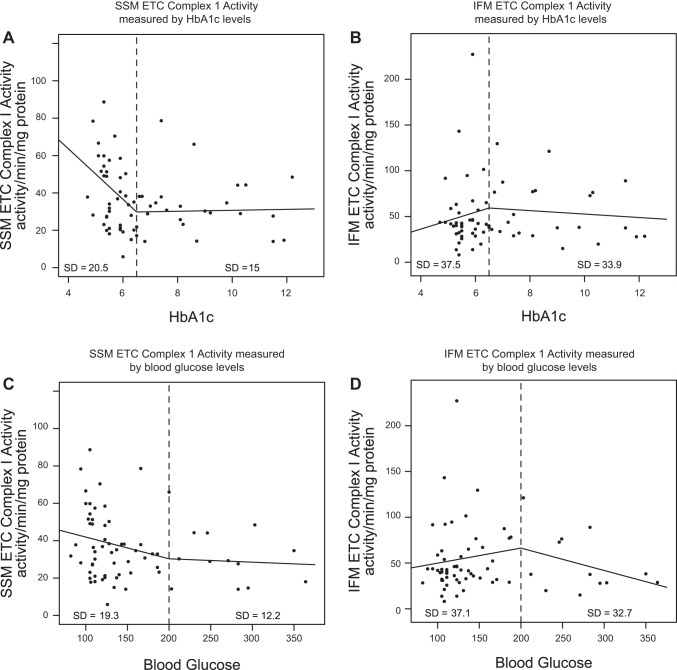
Fig. 5.
Linear spline illustration for ETC complex I activity. Linear spline models for HbA1c and ETC complex I activity were performed with a break point at an HbA1c level equal to 6.5% (dashed line). The linear relationship before and after the break point are plotted for SSM (n = 34 patients without diabetes, and n = 34 patients with diabetes; A) and IFM (n = 34 patients without diabetes, and n = 33 patients with diabetes; B) with dots representing each patient with a reported HbA1c level (n = 34 patients without diabetes, and n = 33 patients with diabetes). A linear spline model for blood glucose and ETC complex I activity was performed with a break point at a blood glucose level equal to 200 mg/dl (dashed line). The linear relationship before and after the break point are plotted for SSM (n = 36 patients without diabetes, and n = 33 patients with diabetes; C) and IFM (n = 36 patients without diabetes, and n = 32 patients with diabetes; D) with dots representing each patient with a reported blood glucose level (n = 36 patients without diabetes and n = 32 patients with diabetes). Units are activity per minute per milligram of protein.

