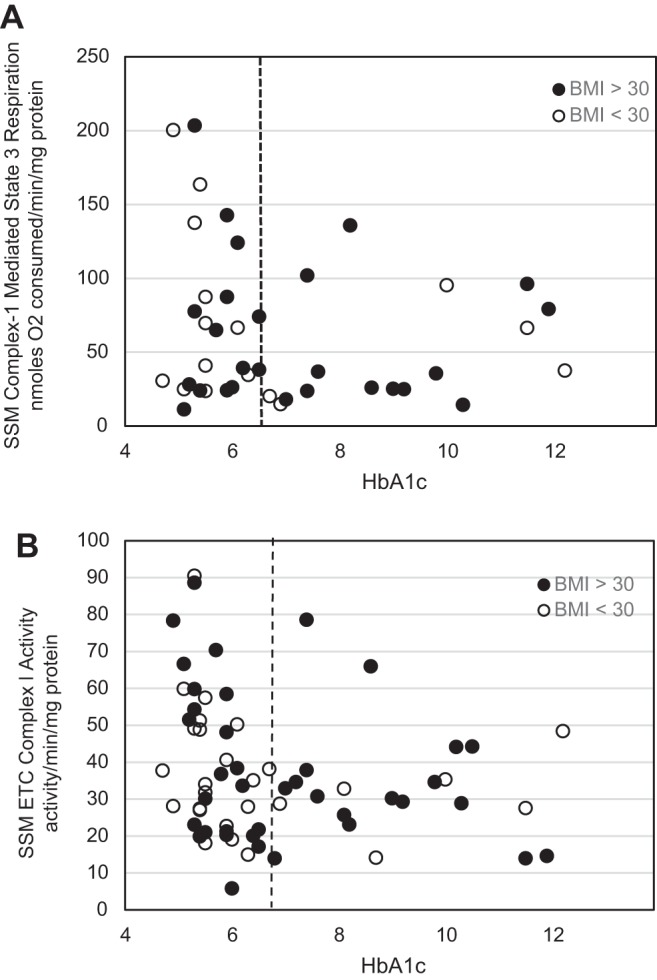
Fig. 8.

Linear spline illustration for state 3 mitochondrial respiration and ETC complex I activity and its relationship to body mass index. Linear spline models for HbA1c and SSM state 3 mitochondrial respiration and SSM ETC complex I activity, respectively, with a break point at an HbA1c level equal to 6.5% (dashed line) are shown. Same linear spline models as Fig. 3A (A) and Fig. 5A (B) with dots representing each patient with a reported HbA1c level are shown. White dots represent patients whose body mass index (BMI) is <30 kg/m2, whereas black dots represent patients whose BMI is >30 kg/m2. Units are nanomoles O2 consumed per minute per milligram of protein and activity per minute per milligram of protein for ETC complex I activity.
