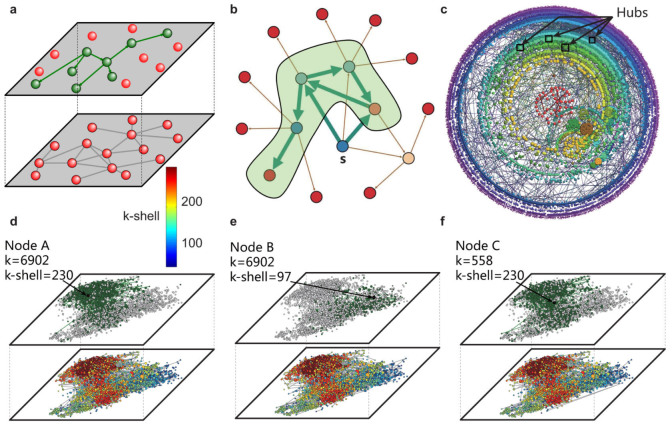
Figure 1. Schematic illustrations for diffusion process and network structure.
(a), A schematic illustration of two-layer structure of connectivity and diffusion. The lower layer displays social network while the upper layer represents the information diffusion. (b), An example of a diffusion instance starting from source node s. The influence region of s shaded in green contains 5 nodes. (c), The k-shell structure of LJ social network. The kS indices increase as we move from the periphery to the center. The node's degree is reflected by its size. Here we highlight four hubs located in the periphery of network. This inset is created with the Lanet-vi tool (http://lanetvi.soic.indiana.edu/lanetvi.php). (d–f), The influence of the spreading process cannot be predicted by degree reliably. For the LJ network, we compare the influence area of single nodes with the same degree k = 6902 (nodes A and B) or the same index kS = 230 (nodes A and C). In the lower level of the corresponding plots, nodes' k-shell indexes are marked with different colors. In the upper level, nodes with green color constitute the influence area, while the grey nodes are not influenced by the source node.

