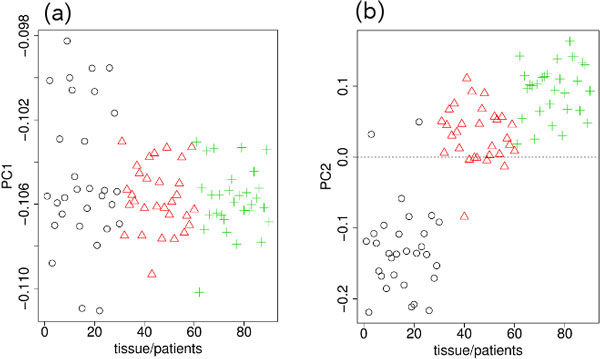
Figure 1.

PCs for genotypes measured by Nsp microarray. (a) PC1 (81%). (b) PC2 (3%). Black circle, blood; red triangle, normal tissue; green cross, tumor tissue. The horizontal axes indicate the subjects and their samples. The order of the 30 subjects in the 1―30, 31 ―60, and 61―90 sections are the same; i.e., 1, 31, and 61 are samples from the same patient.
