Figure 3.

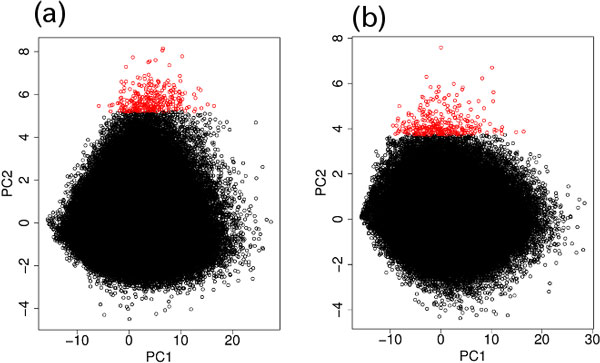
Two dimensional embedding of SNPs with PC1 and PC2 for the Nsp microarray measurements. (a) Genotype (Figure 1). (b) DNA methylation (Figure 2). The top 300 outliers are shown in red.

Two dimensional embedding of SNPs with PC1 and PC2 for the Nsp microarray measurements. (a) Genotype (Figure 1). (b) DNA methylation (Figure 2). The top 300 outliers are shown in red.