Figure 4.

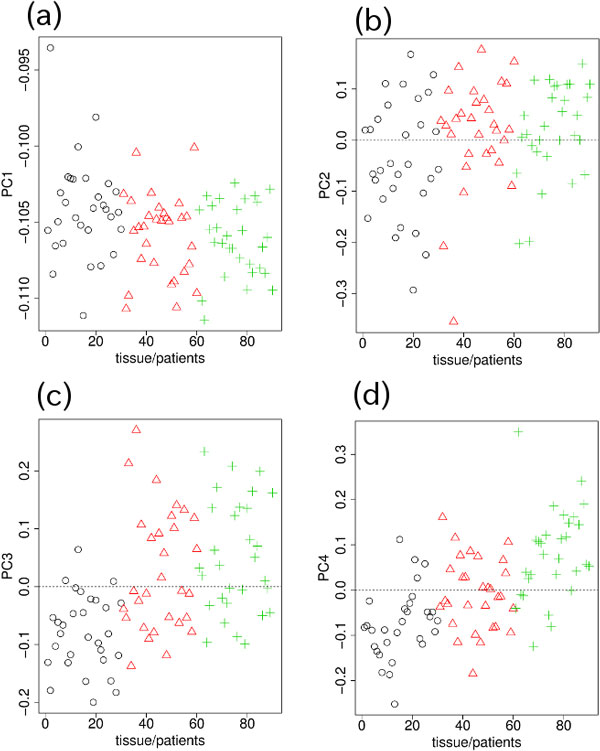
PCs for genotype measured by Sty microarray.(a) PC1 (81%). (b) PC2 (3%). (c) PC3 (2%). (d) PC4 (1%). Other notations are the same as those in Fig. 1.

PCs for genotype measured by Sty microarray.(a) PC1 (81%). (b) PC2 (3%). (c) PC3 (2%). (d) PC4 (1%). Other notations are the same as those in Fig. 1.