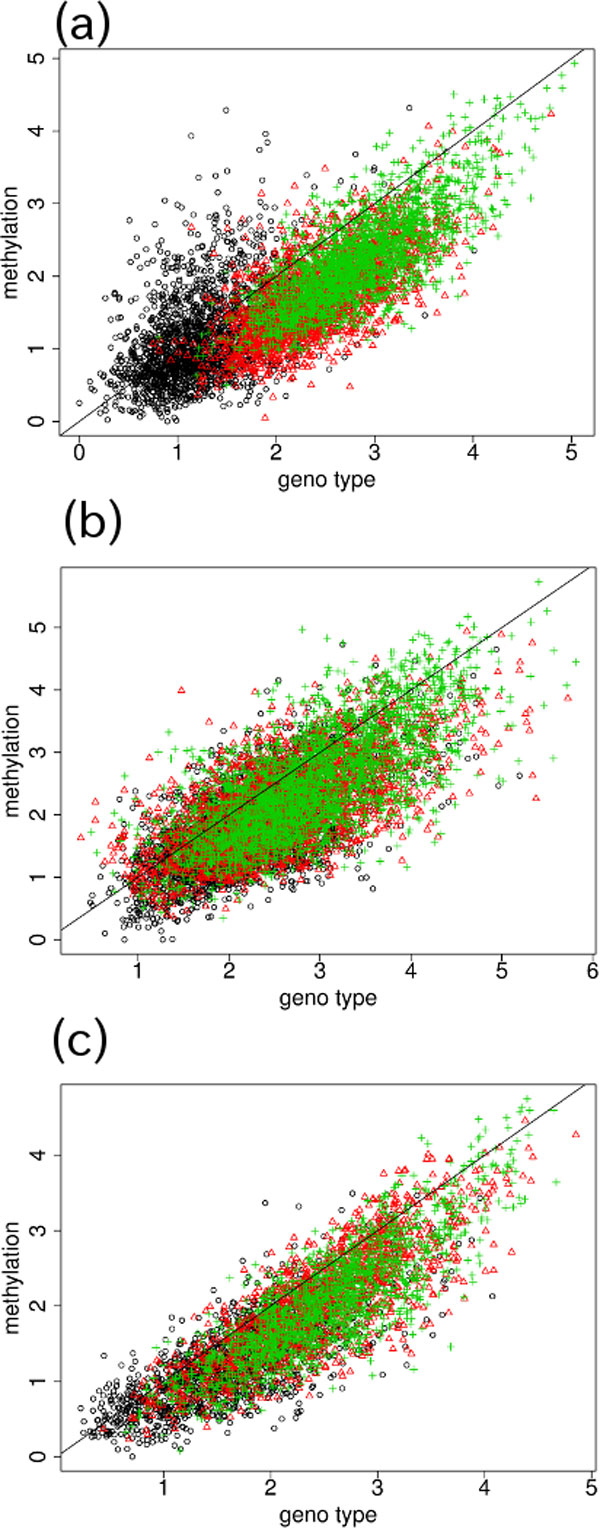
Figure 7.

Comparison of microarray measurements between genotype and DNA methylation. Comparison of (a) 68 SNPs selected with the Nsp microarray data set and (b) 81 SNPs selected with the Sty microarray data set using PC4 for genotype (Figures 4d and 6b) and PC3 for DNA methylation (Figures 5c and 6c). Comparison of (c) 50 SNPs selected with the Sty microarray using PC3 for genotype (Figures 4c and 6a) and PC4 for DNA methylation (Figures 5d and 6d). Black circle, blood; red triangle, normal tissue; green cross, tumor tissue. Solid lines indicate the boundary where the microarray measurements are equal between genotype and DNA methylation.
