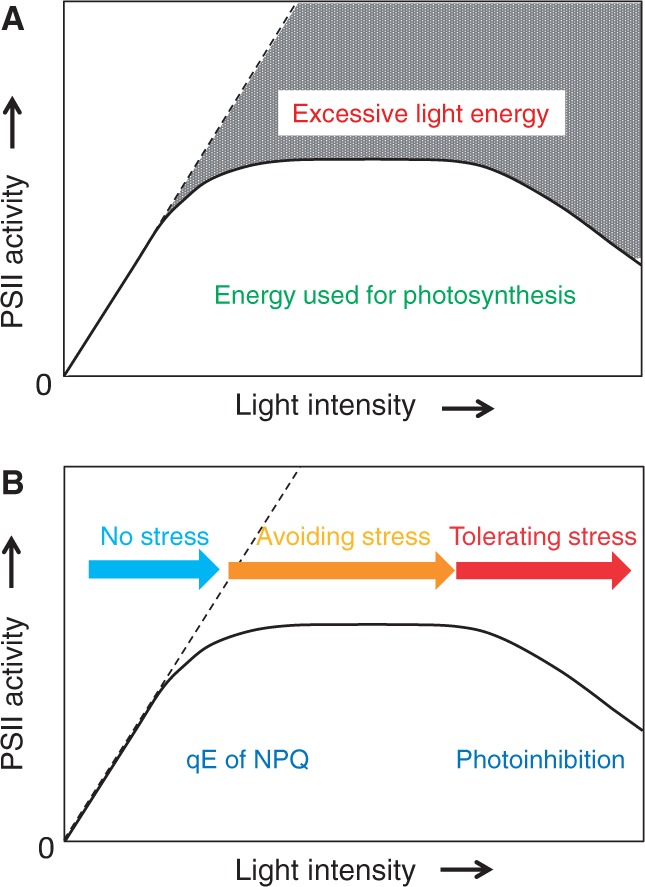
Fig. 1.

Light response curve for PSII activity. The solid line shows PSII activity at various light intensities, while the broken line represents the input energy, or PSII activity in the absence of any rate-limiting factors. (A) Energy usage in PSII. The gray shaded area represents excessive light energy. The area below the solid line corresponds to the energy used for photosynthesis. (B) Relationship between qE of NPQ and photoinhibition of PSII in the light–response curve. Under low light, PSII activity increases in proportion to the light intensity. No light stress is likely under this condition (indicated by the blue arrow). With increasing light intensity, PSII activity gradually decreases and reaches a plateau. Under these conditions, chloroplasts avoid light stress using the qE mechanism of NPQ (indicated by the orange arrow). The qE takes place through aggregation of LHCII activated by acidification of the thylakoid lumen and zeaxanthin formation by the xanthophyll cycle, and it acts to dissipate excessive light energy as heat. Under high-intensity light, photoinhibition prevails. PSII tolerates the severe light stress by stimulating damage and repair of the reaction center-binding D1 protein (indicated by the red arrow).
