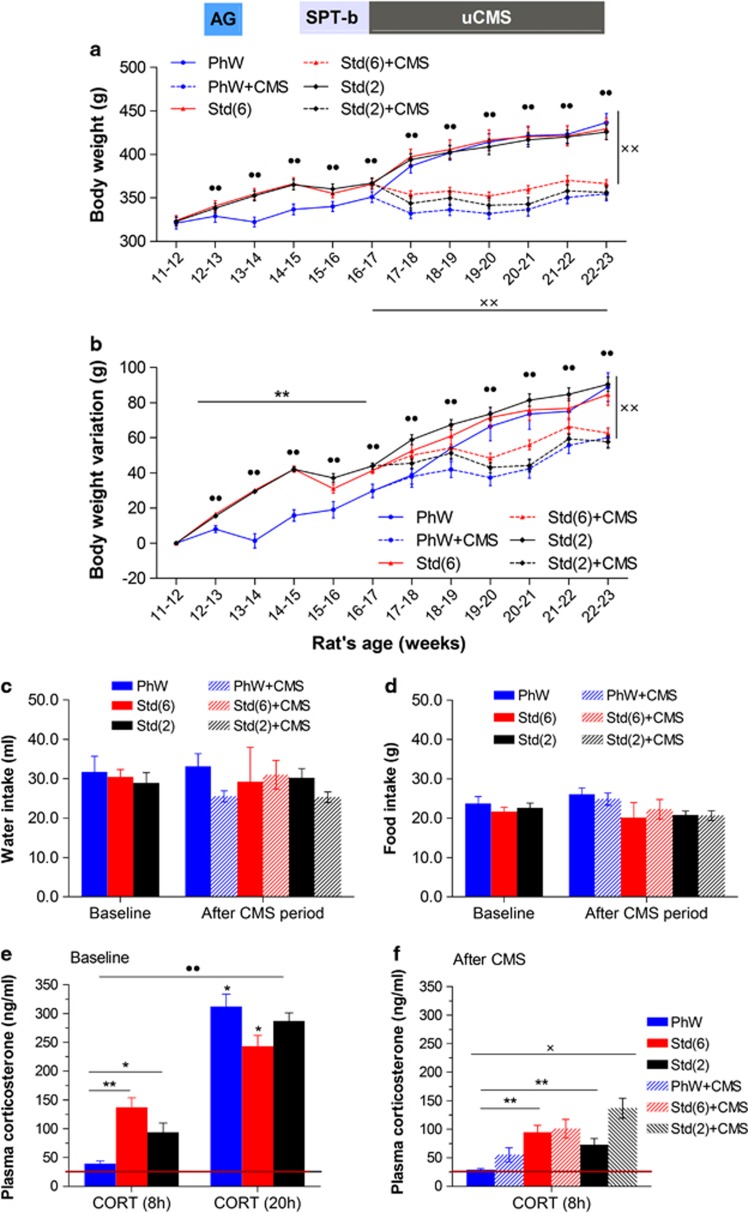
Figure 2.
Body weight (a) and body weight variation (b) of animals living in the PhenoWorld (PhW) compared to animals living in standard cages in groups of six or pair–housed (PhW, Std(6) or Std(2) respectively); dashed lines show that animals living in the same conditions lose weight when submitted to unpredictable chronic mild stress (uCMS) protocol (started at week 16-17 of age for PhW+CMS, Std(6)+CMS and Std(2)+CMS groups). The AnimalGates (AG) blue bar indicates the period when animals housed in the PhW adapted to use the AG; the sucrose preference test (SPT-b) gray bar and the uCMS black bar indicate, respectively, the periods when the baseline SPT and the uCMS protocol were performed. (c) Water and (d) food intake per day per animal. (e, f) Plasma corticosterone levels at baseline and six weeks after: CORT (8 h) indicates the time point when lights went on, and CORT (20 h) indicates the time point when lights went off; the red line on the graphs represents the detection limit for corticosterone measured by radioimmunoassay (25 ng ml–1). Error bars represent s.e.m.; ••P⩽0.001 indicates the effect of time; *P⩽0.05 and **P⩽0.001 denote the effect of housing; xP⩽0.05 and xxP⩽0.001 denote the effect of stress.

