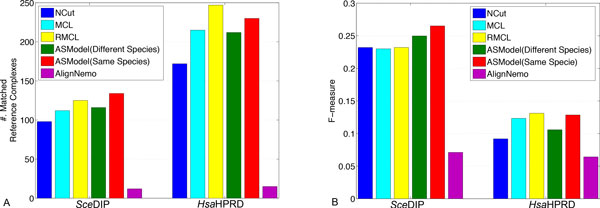
Figure 9.

Performance comparison of competing algorithms for complex prediction in the SceDIP and HsaHPRD network. A. Comparison on the number of matched reference complexes. B. Comparison on the F-measure. ASModel (Different Species) indicates the results obtained by joint clustering of the SceDIP and HsaHPRD PPI networks. ASModel (Same Species) indicates the results obtained from joint clustering of the SceDIP and SceBGS networks for yeast and joint clustering of the HsaHPRD and HsaPIPs PPI networks for human, respectively.
