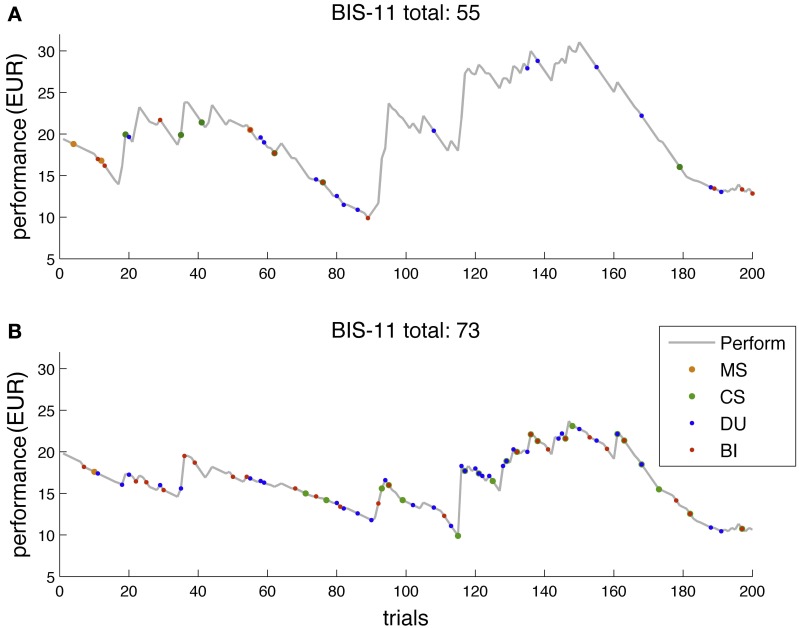
Figure 2.
Two exemplary performance traces for subjects with different BIS-11 scores. (A) Subject with BIS-11 score below average (55). (B) Subjects with BIS-11 score above average (73). Gray trace, performance over the course of the game in EUR. Colored dots are overlayed to the performance trace and reflect events of interest in a particular trial. MS (orange), machine switch; CS (green), casino switch; DU (blue), double-up; BI (red), bet increase. Notably, the more impulsive a subject (i.e., the higher a subject's BIS score), the more the subject exhibited behavioral activation throughout the game, and in particular, in the more volatile phases of the paradigm.

