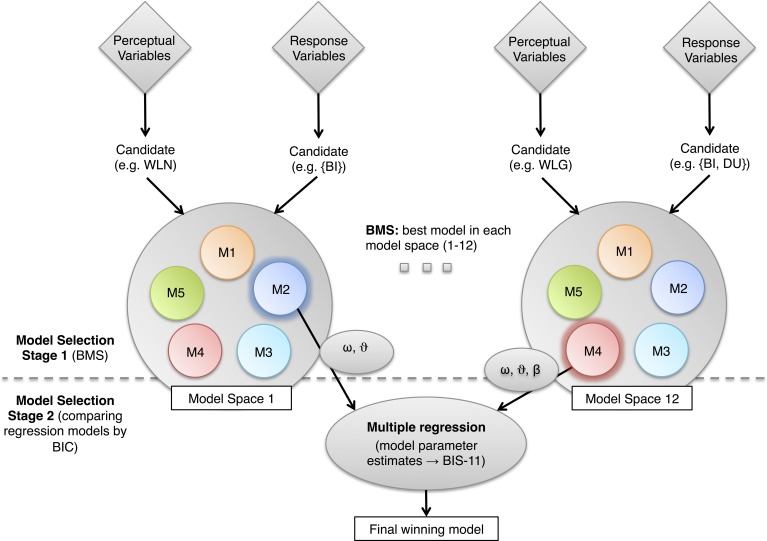
Figure 5.
Model selection stage 1. For each pairing of a perceptual variable with a response variable, Bayesian model comparison was performed, yielding an optimal model (penumbra) for this combination of perceptual/response data features. This optimal model then entered stage 2 (construct validation). Model selection stage 2. To determine the best model with respect to an external measure of impulsivity, we regressed individual BIS-11 scores on model parameter estimates from the 12 models (one for each pair of perceptual variable and response variable) provided by model selection stage 1. The winning model is picked using a BIC comparison across regression models, to account for differing model complexities. BIS-11, Barratt Impulsiveness Scale; WLN, Net Win/Loss; BI, bet increase; DU, double-up.

