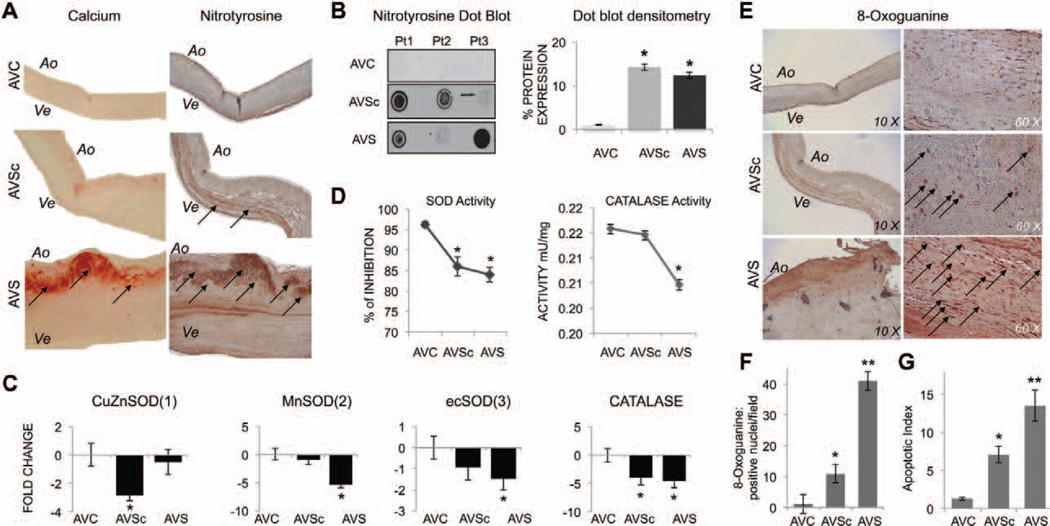
Figure 1.
Oxidative stress accumulation is associated with reduced antioxidant enzymes expression and increased DNA damage in the early stage of calcific aortic valve disease. A, Representative images of Alizarin red stained calcifications (calcium) and nitrotyrosine staining in aortic valve tissue from AVC (control), AVSc, and AVS patients. Magnification, 10×. B, Dot blot for nitrotyrosine and relative densitometry using whole tissue extract from AVC, AVSc, and AVS tissues. Images are representative of dot blot performed in n=6 tissue/group. C, Bar graphs show fold change gene expression for superoxide dismutase 1, 2, 3 (SOD1, 2, 3) and catalase (CAT) in aortic valve tissues. Real Time polymerase chain reaction data were normalized against actinB gene expression and AVC tissue was used as basal. D, SOD and CAT activity measured in aortic valve tissue (n=3/group). *represents P<0.05 and refers to values toward AVC. E, Representative images of 8-oxo-guanine staining in aortic valve tissue from AVC, AVSc, and AVS patients. Magnification, 10× to 60×. F, Quantification of 8-oxo-guanine staining: positive nuclei were counted in 4 different field/tissue section and averaged (n=3 tissues/group analyzed). G, Quantification of apoptotic cells detected by TUNEL assay performed on tissues section. *represents P<0.05 and refers to values toward AVC. **represents P<0.05 and refers to values toward AVSc and AVC. Ao indicates aortic; AVC, aortic valve calcification; AVS, aortic valve stenosis; AVSc, aortic valve sclerosis; Pt1, 2, 3, patient number 1, 2, 3; and Ve, ventricularis.

