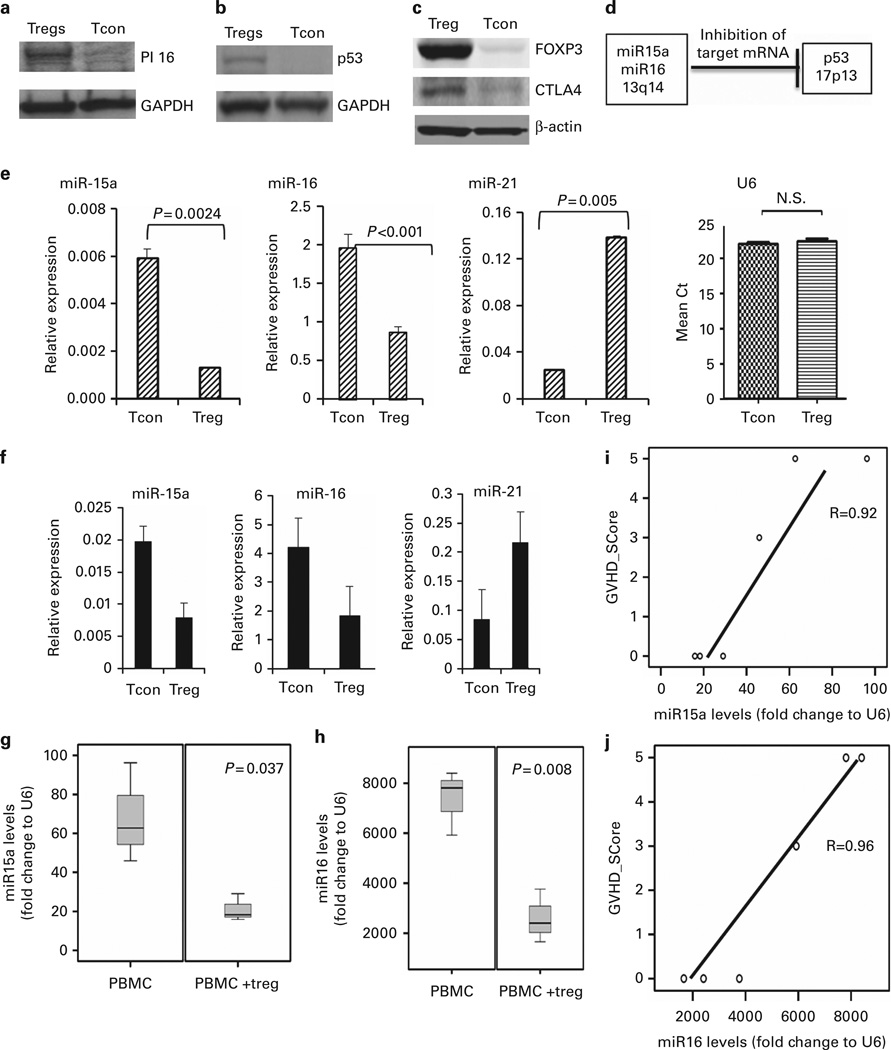
Figure 1. CB Tregs express low levels of miR15a/16.
(a) CB Tregs show higher expression of PI16. Equal amounts of total cell lysates from expanded Tcons and Tregs were analyzed by SDS-PAGE and immunoblotted with antibody against peptidase inhibitor 16 (PI16). The blot was stripped and reprobed with antibody against GAPDH to control for protein loading (representative blot from three different experiments is shown). (b) CB Tregs show higher expression of p53. Equal amounts of total cell lysates from expanded Tcons and Tregs were analyzed by SDS-PAGE and immunoblotted with antibody against p53. The blot was stripped and reprobed with antibody against GAPDH to control for protein loading (representative blot from three different experiments is shown). (c) CB Tregs show higher expression of FOXP3 and CTLA4. Equal amounts of total cell lysates from expanded Tcons and Tregs were analyzed by SDS-PAGE and immunoblotted with antibody against FOXP3 and CTLA4. The blot was stripped and reprobed with antibody against actin to control for protein loading (representative blot from three different experiments is shown). (d) p53 negatively regulates miR15a/16. Adapted from Fabbri et al.,24 a negative control between p53 and miR15a/16 is demonstrated in normal tissues. (e) miR15a and miR16 expression is lower in CB Tregs when compared with Tcons. miR15a and miR16 levels were quantified using quantitative reverse transcription-PCR (qRT-PCR). The comparative cycle time (Ct) method was used to calculate the relative abundance of microRNAs compared with snRNA U6 as an internal control for RNA normalization. Significantly lower miR15a (P =0.0024) and miR16 (P < 0.001) were seen in CB-derived Tregs when compared with Tcons. miR21 is increased in CB Tregs (P=0.005), shown as a positive control. (f) miR15a and miR16 expression is lower in PB Tregs when compared with Tcons. miR15a and miR16 levels were quantified using qRT-PCR. The Ct method was used to calculate the relative abundance of microRNAs compared with snRNA U6 as an internal control for RNA normalization. Lower miR15a and miR16 were seen in PB-derived Tregs when compared with Tcons. miR21 is increased in PB Tregs, shown as a positive control. Decreased miR15a/16 in circulating lymphocytes of CB Treg recipients in xenogenic GVHD model. Sublethally irradiated gamma null mice were injected with human PBMC with or without preceding third party CB Treg injection in 1:1 ratio to evaluate for development of GVHD. The expression of miR15a or miR16 in the circulating lymphocytes on Day 14 for recipients of PBMC or those with Tregs and PBMC (expressed as fold change to snRNA U6, as an internal control for RNA normalization) was analyzed. (g) The miR15a levels (P=0.037; two-tailed t-test) and (h) miR16 levels (P =0.008; two-tailed t-test) were decreased in PBMC+Treg recipients when compared with PBMC-only group. The miR15a (i; regression coefficient 0.92) and miR16 (j; regression coefficient 0.96) levels in the circulating lymphocytes correlated with the GVHD score of the animals.

