Fig. 1.—

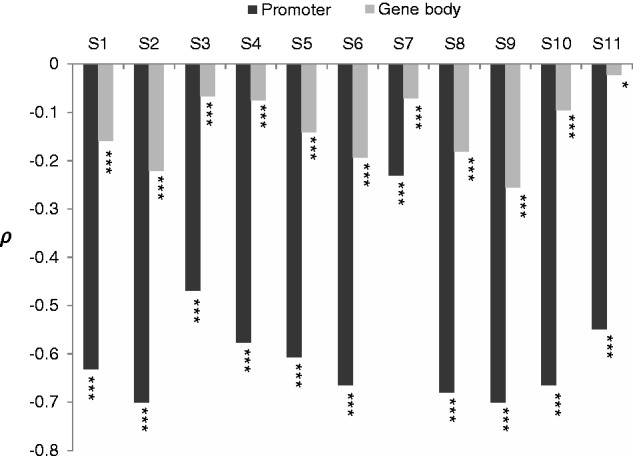
Spearman’s rank correlation coefficient (ρ) between CpGO/E and mCG density for the promoter and gene body regions in the 11 analyzed methylomes. *P < 0.05 and ***P < 0.001.

Spearman’s rank correlation coefficient (ρ) between CpGO/E and mCG density for the promoter and gene body regions in the 11 analyzed methylomes. *P < 0.05 and ***P < 0.001.