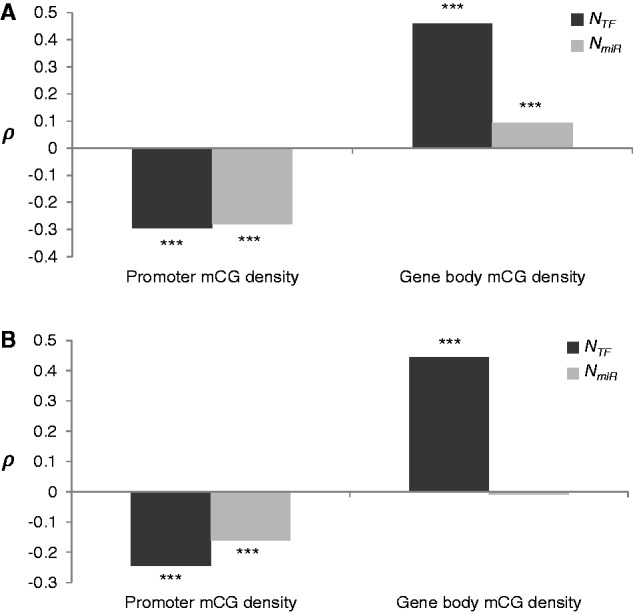
Fig. 2.—

Spearman’s rank correlation coefficient (ρ) between average promoter/gene body mCG densities for the 11 analyzed samples (table 1) and the 2 regulatory factors (NTF or NmiR) (A) before and (B) after controlling for 10 other confounding factors (see text). The analyses were based on 5,418 genes containing all confounding factors examined. ***P < 0.001.
