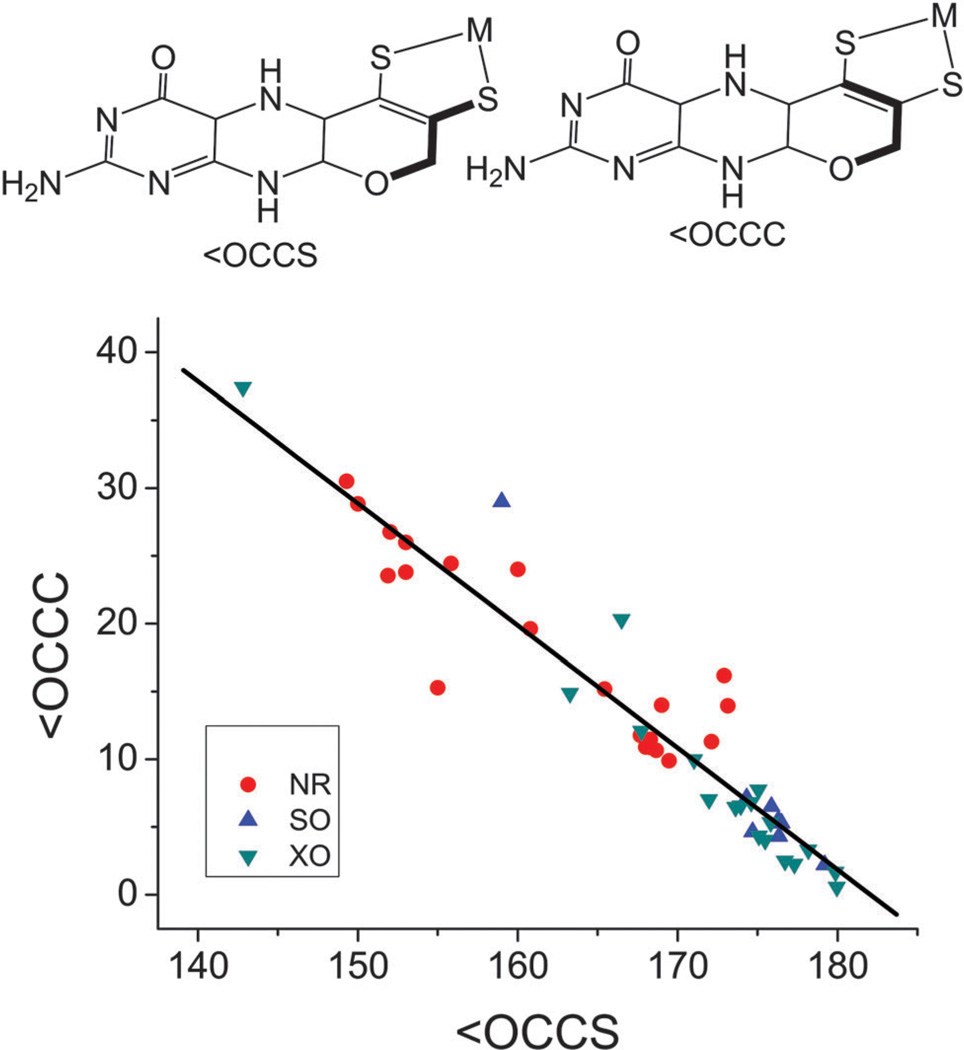
Fig. 5.
Plot of two torsion angles (highlighted in bold lines) in molybdenum cofactors in SO, XO and NR. The linear line is represented by the equation [<OCCC] = 163.9(±7.4) – 0.95(±0.04) × [<OCCS] (N = 49; R2 = 95; P < 0.0001). Note that values in NR exhibit a larger spread, those of XO and SO are tightly clustered, with the exception of four points, which are representing substrate or inhibitor bound form or eukNR.

