
Figure 15.
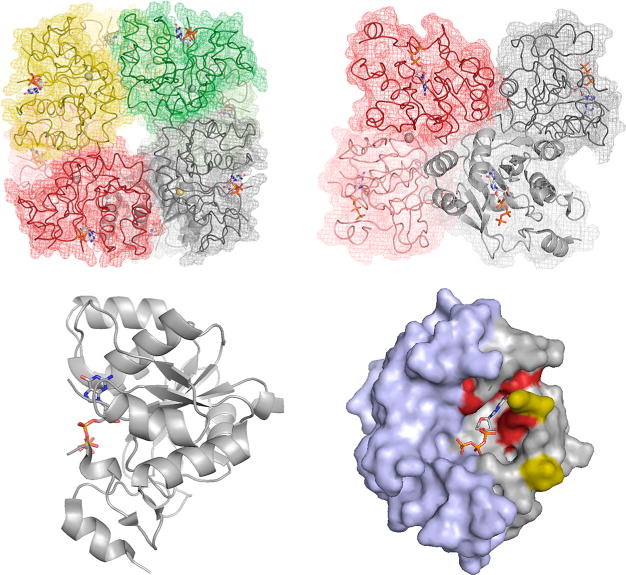
The structure of E. coli MobA in complex with GTP (PDB 1FRW). Top left, the overall arrangement of the octamer, with the zinc ions indicated demarking the subunit interface of dimers (the subunits of which are shown in dark and light shades of the same color). Bound GTP is indicated shown in CPK. Top right, a side view of the octamer, illustrating the disposition of the GTP binding sites with respect to one another. Bottom left, a ribbon representation of one subunit shown from the side. Right, a space-filling representation looking into the GTP binding site. The N-terminal nucleotide-binding domains are in gray, and the C-terminal domain that interacts with apoenzymes requiring the dinucleotide product is in blue. Residues imparting specificity for GTP as opposed to MCD are shown in red.80 It is to be noted that a seven-residue stretch between Lys 16 and Val 23 (yellow) is unresolved in the crystal structure, and the substrate is likely more protected from solvent than the image implies.