
Figure 49.
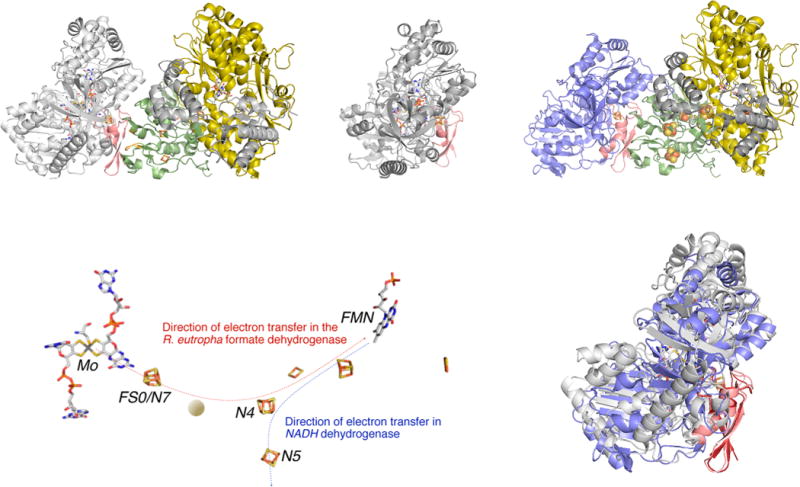
A model for the structure of the FdsGBA formate dehydrogenases. The model was obtained by superimposing the FS0 [4Fe-4S] cluster of FdhF from E. coli (PDB 1AA6) with the N7 [4Fe-4S] cluster of the Nqo3 subunit of T. thermophilus NADH dehydrogenase (PDB 3IAM), with the Nqo1 and Nqo2 subunits (which have strong homologies to FdsB and G, respectively) included in the model. Upper left, the model for FdsGBA; upper right, the structures of FdhF (with the molybdenum-binding portion of the protein in gray) and Nqo1–3 (in yellow, gra,y and green/blue, respectively), with the putative overlap region in red from which the model was constructed. This region contains iron–sulfur cluster FS0 in FdhF and N7 in the Nqo3 subunit of NADH dehydrogenase. Lower left, the disposition of the redox-active centers in the model, with the approximate position of the additional iron–sulfur cluster known to be present in the R. eutropha enzyme indicated by the orange ball. The orientation of the overall complex is the same as in upper left. Lower right, an alignment of the molybdenum-binding portion of FdhF with the C-terminal domain of Nqo3 (in blue, upper right). The rms deviation is 2.7 Å over 428 Cα atoms.428a